Thanks to Urban Lagerström here is a great pnp4nagios php script to plot performance data from Bischeck. Deploy it on your Nagios server running pnp4nagios.
<?php

#

$opt[1] = "--title \"$hostname / $servicedesc\" ";

#

#

$def[1] = rrd::def("var1", $RRDFILE[1], $DS[1], "AVERAGE");

$def[1] .= rrd::gradient('var1','0000a0','C0C0C0','Measured ',20);

$def[1] .= rrd::gprint("var1", array("LAST", "AVERAGE", "MAX"), "%8.0lf");

$def[1] .= rrd::def("var2", $RRDFILE[1], $DS[2], "AVERAGE");

$def[1] .= rrd::line1("var2", "#000000", "Threshold ") ;

$def[1] .= rrd::gprint("var2", array("LAST", "AVERAGE", "MAX"), "%8.0lf");

$def[1] .= rrd::def("var3", $RRDFILE[1], $DS[3], "AVERAGE");

$def[1] .= rrd::def("var4", $RRDFILE[1], $DS[4], "AVERAGE");

$def[1] .= rrd::cdef("warnThresh","var2,var3,+");

$def[1] .= rrd::line1("warnThresh", "#EACC00","Warning U ");

$def[1] .= rrd::cdef("warnThreshD","var2,var3,-");

$def[1] .= rrd::line1("warnThreshD", "#FFFF00", "Warning L");

$def[1] .= rrd::gprint("var3","LAST","%8.0lf Delta\\n");

$def[1] .= rrd::cdef("critThresh","var2,var4,+");

$def[1] .= rrd::line1("critThresh", "#FEACC0","Critical U ");

$def[1] .= rrd::cdef("critThreshD","var2,var4,-");

$def[1] .= rrd::line1("critThreshD", "#FF0000", "Critical L");

$def[1] .= rrd::gprint("var4","LAST","%8.0lf Delta\\n");

?>
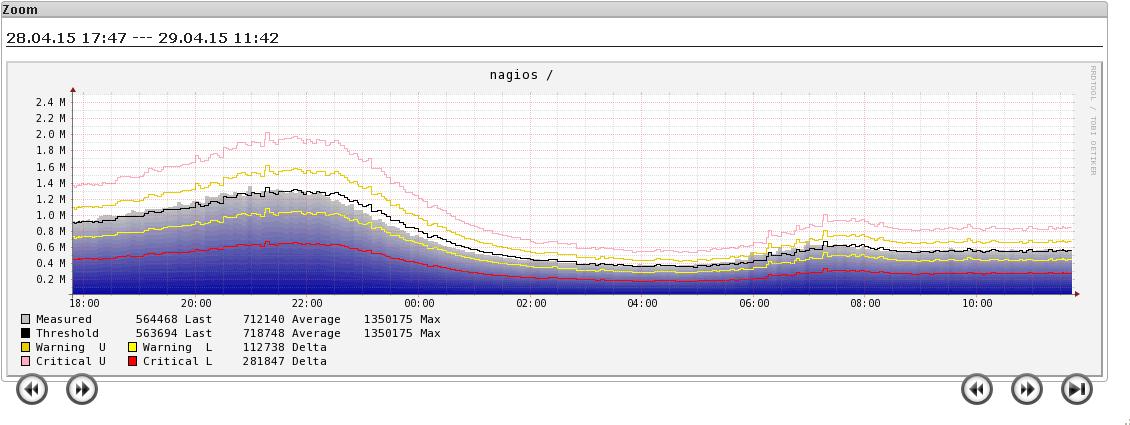
This will create nice graphs like the example below.
Thanks to Urban to share this solution. To see Urbans original post on IngbyForge check here.
