Bischeck
High-level features supported in Bischeck:
- Dynamic and adaptive thresholds.
- Configuration of thresholds baselines depending of time of the day and day of month or week and so forth.
- Thresholds can be based on fixed static values and/or thresholds based on measured values from other services. This is very useful in an adaptive process driven businesses.
- Custom threshold classes to enable any given definition of threshold logic.
- Large number of mathematical functions that can be used to calculate thresholds.
- Historical data cache for all collected data. All can be retrieved based on index or time. Cache data is the main source for creating dynamic and adaptive thresholds.
- Multiple scheduling schema per service. This enables a fine grained control of when monitoring should be run. Bischeck supports interval scheduling, cron scheduling and service relation-based scheduling.
- Configuration of services that are based on multiple measured values of other services. This can be described as “virtual” entities. Excellent for ratio calculations.
- Date macros are supported in the execution statement in a service, typically used in a where clause when collecting data from databases.
- Packaged connection methods for databases, livestatus and execution of any Nagios plugin.
- Multitude of ways to connect to source systems by allowing custom developed service connection methods.
- Integrates with multiple monitoring and surveillance tools, such as any Nagios-based distribution.
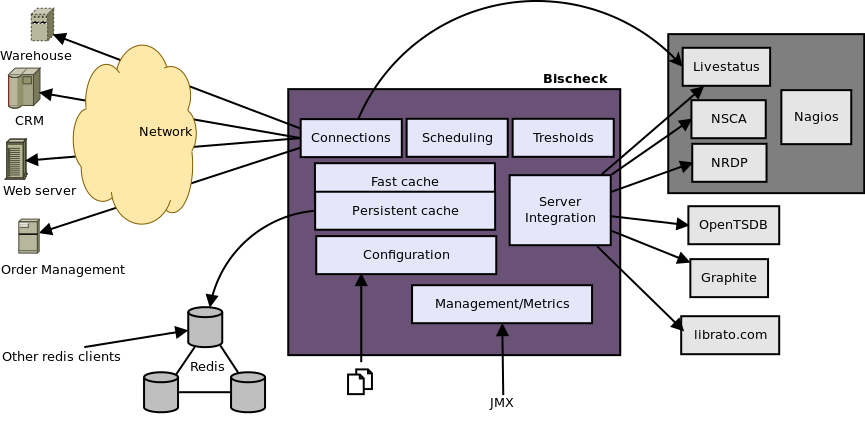
The bischeck architecture include the following main components:
- Configuration – Manage all configuration of bischeck
- Scheduling – Controls the execution time of each service
- Connection – Manage connection management against the source systems to monitor
- Threshold – Manage the threshold configuration and processing
- Cache – Storage of all values that has been collected from the source systems
- Server integration – Manage integration and formatting to the different monitoring systems
Bischeck is written in Java and operates as a stand-alone daemon and integrates with different monitoring and surveillance tools over open protocols. Bischeck integrates with Nagios Core, Nagios XI, OP5 but should work with any Nagios distribution supporting the NSCA protocol, NRDP or Livestatus like, Naemon, Opsview, Groundworks, Icinga and Shinken.
Bischeck supports installation on RedHat, Centos, Debian and Ubuntu. Windows support is currently not available out of the box, but has been tested using Yajsw as a service wrapper.

You can take the results directly from nagios using livestatus. Using this method you decided what performance metrics or state information you should query into bischeck.
Query state you can use the state value in your calculations. For more information check the documentation page.