At last we have started to move the bischeck project to Github. We will also use Github to store binary distributions and for issues. The old Ingbyforge site will be taken offline during January so any new issues or feature request should be done at Github. Old bug reports and feature request will be archived and published on www.bischeck.org. If you have any open feature requests that you like to keep open please re-create them on Github.
Bischeck 1.1.2 released
Bischeck 1.1.2 has been released. The release only include 2 important bug fixes related to negative metrics values and to time based purging. Thanks to Pasquale Settanni and Urban Lagerström for finding the bugs.
Want to plot interval based threshold with extended warning and critical data with pnp4nagios?
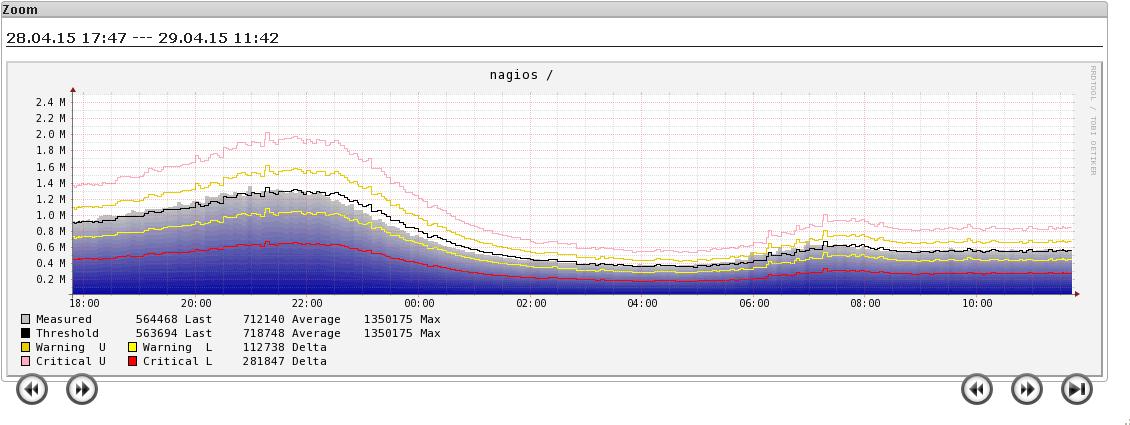
Thanks to Urban Lagerström here is a great pnp4nagios php script to plot performance data from Bischeck. Deploy it on your Nagios server running pnp4nagios.
<?php

#

$opt[1] = "--title \"$hostname / $servicedesc\" ";

#

#

$def[1] = rrd::def("var1", $RRDFILE[1], $DS[1], "AVERAGE");

$def[1] .= rrd::gradient('var1','0000a0','C0C0C0','Measured ',20);

$def[1] .= rrd::gprint("var1", array("LAST", "AVERAGE", "MAX"), "%8.0lf");

$def[1] .= rrd::def("var2", $RRDFILE[1], $DS[2], "AVERAGE");

$def[1] .= rrd::line1("var2", "#000000", "Threshold ") ;

$def[1] .= rrd::gprint("var2", array("LAST", "AVERAGE", "MAX"), "%8.0lf");

$def[1] .= rrd::def("var3", $RRDFILE[1], $DS[3], "AVERAGE");

$def[1] .= rrd::def("var4", $RRDFILE[1], $DS[4], "AVERAGE");

$def[1] .= rrd::cdef("warnThresh","var2,var3,+");

$def[1] .= rrd::line1("warnThresh", "#EACC00","Warning U ");

$def[1] .= rrd::cdef("warnThreshD","var2,var3,-");

$def[1] .= rrd::line1("warnThreshD", "#FFFF00", "Warning L");

$def[1] .= rrd::gprint("var3","LAST","%8.0lf Delta\\n");

$def[1] .= rrd::cdef("critThresh","var2,var4,+");

$def[1] .= rrd::line1("critThresh", "#FEACC0","Critical U ");

$def[1] .= rrd::cdef("critThreshD","var2,var4,-");

$def[1] .= rrd::line1("critThreshD", "#FF0000", "Critical L");

$def[1] .= rrd::gprint("var4","LAST","%8.0lf Delta\\n");

?>
This will create nice graphs like the example below.
Thanks to Urban to share this solution. To see Urbans original post on IngbyForge check here.
Status update on Bischeck 2.0.0
You probably think there has not been enough news from the Bischeck project during the autumn, but we have not been totally lazy. In August I published a post about the future of Bischeck and some of this is now starting to be ready for release. Our goal is to get a beta version of this work out during Q1 2015.
The new version of Bischeck will be 2.0.0. The reason why we bump up the major version is that we broke some of the data structures we store in Redis, but migration will be available. So what are the new features you can expect in Bischeck 2.0.0?
Contents
Bischeck 2.0.0
State and notification
In the previous version bischeck only collected metric, evaluated threshold logic and pushed the result to Nagios or equivalent tools. With bischeck 2.0.0 we have implemented state and notification management. This resembles the Nagios way where you have the concept of hard and soft state.
State changes and notifications are stored in Redis as sorted sets, sorted by timestamp. The sets are prefixed with state/{key} and notification/{key} where the key is the host-service part of the service definition. There is also additional data structures where all host-service’s are stored based on their state. This enables quick look-ups for all host-service’s currently in a specific state, i.e get all in CRITICAL state.
Notification integration
One of the main reason for the additional data structures are that state changes and notifications can be directly integrated with external tools. In 2.0.0 we will support notification integration with Pagerduty and BigPanda.
Before 2.0.0 the only integration was provided by Server classes, i.e. NSCAServer class to integrate passive checks with Nagios. In 2.0.0 we introduce a new interface to support integration of notifications. This integration send information only when notification state changes. This means that services as PagerDuty can be used instead or as a complement to Nagios to manage notifications. Notification classes can be custom developed in the same way as Server classes.
Robustness and thread safeness
Robustness and thread safeness has been improved by using a clear data object separation, using value objects, between the ServiceJob execution and any Server and Notification classes that provide integration, i.e. to Nagios, Graphite, PagerDuty, etc. Since the internal communication between a ServiceJob and the consuming integration classes are based on an asynchronous message passing, jetlang, it is important to use an immutable object when passing the data. This will enable future optimization implemented in Server and Notification classes, like batching of data.
Feature request
Feature requests implemented in 2.0.0 are FR-258 and FR-262 (merged with FR-258) submitted by Pasquale Settanni.
From ant to maven
We have also switched the build process to use maven instead of ant.
BisAPI – rest API for Bischeck
In parallel to the development with Bischeck we started a new project called BisAPI. BisAPI will provide rest API’s to Bischeck data about collected metrics, states, notifications, etc. BisAPI runs as a separate process and connects directly to Redis. BisAPI use the open-source project spark that implement a simple and lightweight web framework. With BisAPI we hope to enable the first step for a Bischeck web UI. If anyone is interested and like front-end development please contact me and I will help you get started.
We will soon release more detailed information about the API’s, but here are some examples that will get all data related to collected metrics, state and notification for a specific key.
http://localhost:9080/v1/metric/:key
http://localhost:9080/v1/state/:key
http://localhost:9080/v1/notification/:key
The key is for metric a full host-service-serviceitem name and for state and notification the key is the host-service name.
All the above API’s can take the following query parameters:
- f – filter of the field to be shown in the result, i.e. state, value, etc
- q – query based selection, i.e. state==”CRITICAL”&×tamp>1417997243271. Remember that characters like & and < must be encoded. & (%26) and < (%3C)
- from – Start index for the selected result – default 0
- to – The end index or offset how many to retrieve, default is 100. If using offset it should be given as +X, encoded to %2BX.
The result is a json object with the following format:
{
“key”: “host0-avgrand-avg”,
“count”: 2,
“processingTime”: 4,
“result”: [
{
“timestamp”: 1417997368271,
“value”: 6.835832,
“threshold”: 4.0060363,
“calcmethod”: “>”,
“state”: “OK”
},
{
“timestamp”: 1417997363271,
“value”: 6.6700892,
“threshold”: 4.0060363,
“calcmethod”: “>”,
“state”: “OK”
}
],
“links”: [
{
“title”: “metric”,
“method”: “GET”,
“rel”: “self”,
“href”: “metric/host0-avgrand-avg”
},
{
“title”: “metric”,
“method”: “GET”,
“rel”: “aggregation”,
“href”: “metric/host0-avgrand%2FH%2Favg%2Fweekend-avg”
},
{
“title”: “notification”,
“method”: “GET”,
“rel”: “notification”,
“href”: “notification/host0-avgrand”
},
{
“title”: “state”,
“method”: “GET”,
“rel”: “state”,
“href”: “state/host0-avgrand”
}
]
}
As you can see from above the response json include the following fields:
- key – the key that was in the request url
- count – the number of items returned in the result section
- processingTime – the time in millisecoends to execute the call, not including time in the framework.
- result – an array of the entities
- link – an array of related links
There will be a number of additional API’s that we will provide more information about soon. Remember this is still in development and may change.
If you like to test BisAPI today you need to checkout the bischeck trunk and the bisapi unstable. As you can see from the bisapi url, BisAPI is hosted on github. The plan is to migrate bischeck to github sometime during the spring.
We hope you like the progress thats been done and the new features that will be available with Bischeck 2.0.0. Input and feedback is always welcome.
We also would like to encourage you to share your experience and use cases with Bischeck to us and the community. As an open-source project we are not “in it for the money”, what drives us if its useful and valuable for you, so please share.
Improved performance with 1.1.1 for time based queries
Thanks to Rahul Amaram we where made aware of a big performance bottleneck in Bischeck 1.1.0. Rahul’s use case was that he need to keep around 15000 metrics for each service definition in the cache to create thresholds. When calculating the threshold he used time based queries, but when the cache size grow on an individual service definition the cpu utilization started to increase both for the bischeck java process and the redis server.
Continue reading Improved performance with 1.1.1 for time based queries
Bischeck 1.1.1 released
Bischeck 1.1.1 just fix two trouble tickets, but one had a major performance impact in some use cases where time based queries are used. Checkout this post for more information. For more info on the specific changes in the release check out the release notes.
Configuration Bischeck cache directives
Yesterday we got the following question on the mailing list that I think many others are also struggling with.
Hi,
I am trying to setup the bischeck plugin for our organization. I have configured most part of it except for the cache retention period. Here is what I want – I want to store every value which has been generated during the past 1 month. The reason being my threshold is currently calculated as the average of the metric value during the past 4 weeks at the same time of the day.
So, how do I define the cache template for this? If I don’t define any cache template, for how many days is the data kept?
Also, how does the aggregate function work and and what does the purge maxcount signify?
I’ve gone through the documentation but it wasn’t clear. Looking forward to a response.
Bischeck is one awesome plugin. Keep up the great work. Regards, Rahul.
It’s always great to here that someone thinks its a great product, but now back to the question.
In 1.0.0 we introduce the concept of individual cache purging and aggregations. Even if the two are related from a configuration perspective it is really two independent features. Continue reading Configuration Bischeck cache directives
New Bischeck logo
At last we have a professional created logo for Bischeck. Created by the creative and talented design student Martin Söderberg.
Bischeck now on Bintray
You can from now also find new Bischeck versions on Bintray. Bischeck 1.1.0 already uploaded.
Future of Bischeck
Summer is over, at least in Sweden, and its time to start a new working period until the snow hits the slopes. Even if our day jobs keeps us busy, there will be time for Bischeck development. During the summer holiday we have had some time to think about the future for Bischeck, thoughts and ideas that I like to share with you and hopefully get your feedback on.
From the very beginning Bischeck was an extension to Nagios based distributions. Integration with Nagios is done using passive check, meaning that Bischeck pushed state and metrics data (performance data) to Nagios for a specific service. Nagios take care of all other stuff like notification, escalation, graphing (add-on), GUI, etc. In early releases of Bischeck we also provided integration with more specialized systems like OpenTSDB and Graphite. Integrating with other specialized systems enabled us to focus on core monitoring functionality that we identified was missing in the market, like dynamic and adaptive thresholds, virtual services combining metrics from multiple source, fine grain scheduling, etc. This is the strategy we will continue, so we can be a puzzle piece in your monitoring infrastructure.

So what do we do to achieve this goal?
- Tracking state changes – This would be the equivalent to Nagios HARD and SOFT state changes so Bischeck can be configured to emit notifications. This enable Bischeck to be directly integrated with incident management cloud services like PagerDuty and BigPanda and systems like Flapjack. This is already implemented in the unstable trunk.
- Bischeck API’s – In the same way we like to integrate with other solutions, we like to be integrated from others . In the first phase we will create API’s to retrieve configuration information, metrics data, state history and notification events, to enable others to develop Bischeck dashboards and hooks from other systems. The second phase will target an API to push metrics to Bischeck, to complement the existing scheduled pull design.
- Specification of the cached data formats so external tools can extract, and even import data, directly through existing Redis API.
There are also a number of other features we are looking at:
- Bischeck cluster – Running multiple Bischeck nodes that load balance on “one common” configuration. That would enable scale out and high availability. Redis plays a key part here with its upcoming cluster support.
- Baseline threshold learning – something you can sort of do today, but with minimal configuration.
- Regex based cache queries – This would enable queries like “avg (.*web-http-responsetime[0:9])” to get the average response time for index 0 to 9, for all host that fulfill the name .*web and have a service called http and a serviceitem called responsetime.
- Fault tolerance for configuration error and dynamic reload on a single servicedef, without the need for a complete configuration reload.
- Filtering on cache queries to exclude metrics data that did not match a filter, for example metrics samples that was in state WARNING or CRITICAL.
Please give us feedback what you like or if you have other ideas or wishes. Remember you can always create a feature request at gforge.ingby.com or contact us at bischeck@ingby.com.
Remember that you can get professional service for Bischeck, that will also help us continue our development effort.
Puzzle image created by By Ganeshk (CC license)
Bischeck 1.1.0 is released
Release 1.1.0 is a minor upgrade of Bischeck with some new features. The documentations has been updated to reflect the new stuff in 1.1.0. You should also check out the release note before for you start upgrading from 1.0.X which is the only previous version that is supported for upgrade. If you are still on 0.4.3 upgrade first to 1.0.2 and then to 1.1.0.
In the “Configuration” and “Installation and administration” guide we have marked all the 1.1.0 changes with a label [1.1.0] so it should be easy to search for.
Thanks to everybody that has tested this version. A special thanks goes to Pasquale Settanni at Eutelsat Broadband for his testing effort and valuable feedback, as always.
As usual we look forward to your feedback.
New features
- Command line utility to explore cache content. Support for full syntax of Bischeck mathematical expression to enable simple testing of threshold expressions and virtual services. For more information see the “Bischeck – Installation and administration guide”.
- Server integration with Librato, https://metrics.librato.com/, is now supported. The server integration with Librato enables Bischeck metrics to be sent to Librato’s cloud monitoring service. For more information see the “Bischeck – Configuration guide”.
- NRDP server integration is supported over SSL. Use the property ssl in the server.xml in the NRDP section to enable SSL. Default is false.
- Support to disable SSL (X.509) certification validation for connection over HTTPS, like NRDP. Set the property disableCertificateValidation in the properties.xml. Disable validation have its risks – you have been warned. The default is false. A more secure way to manage certificates is to create a local keystore for Bischeck, see http://docs.oracle.com/javase/6/docs/technotes/tools/solaris/keytool.html. This will also require setup of additional system properties to java that has to be added in the $BISHOME/bin/bischeck script. Loads of documentation exists on the web.
- Support for Jolokia, http://www.jolokia.org/, for JMX remoting. Jolokia is a jmx agent that support HTTP/JSON access and remove all the problems with the standard JMX agent that use RMI. RMI is especially problematic in any network environment with firewalls. With Jolokia its simple to tunnel the JMX connection over ssh. Jolokia provides fine grain security and access capabilities. The RMI based JMX agent is still the default, but that will change in the future releases of Bischeck. If you like to use Jolokia with Bischeck 1.1.0 just uncomment row 53 and comment row 52 in the $BISHOME/bin/bischeck script. Two additional configuration files has been added to the $BISHOME/resources directory to control the behavior of Jolokia:
- jolokia.conf – basic setting, like port. Read more in the “JVM agent” chapter at http://www.jolokia.org/reference/html/agents.html.
- jolokia-access.xml – define policy based security. More info at http://www.jolokia.org/reference/html/security.html
- Add function to calculate the standard deviation on a series of data.
- Add function to calculate the median value on a series of data.
- [FR-252] “Adding the hour level to the period definition”. This feature request enable fine grain granularity of the warning and critical level for a specific hour interval.
....
<period>
  <months>
    <dayofmonth>25</dayofmonth>
  </months>
  <calcmethod>></calcmethod>
  <warning>10</warning>
  <critical>20</critical>
  <hoursIDREF>101</hoursIDREF>
</period>
....
<hours hoursID="101">
  <hourinterval>
    <from>00:00</from>
    <to>11:00</to>
    <threshold>1000</threshold>
  </hourinterval>
  <hourinterval>
    <from>12:00</from>
    <to>24:00</to>
    <threshold>2000</threshold>
    <!−− Override the values from the period section −−>
    <warning>20</warning>
    <critical>30</critical>
  </hourinterval>
</hours>
....
Between 00 – 11:59 the warning and critical values in the period section will be used and between 12 and 23:59 the warning and critical “override” values are used. For the threshold between 11 and 12 the linear equation will be used to calculate the threshold value starting at 1000 at 11:00 and 2000 at 12:00, but the warning and critical will in that time interval be the values from the period section. For more information see the “Bischeck – Configuration guide”.
- Testing of thresholds rules has been enhanced. The bin/bischeck threshold.Twenty4HourThreshold command will list the resolved threshold configuration depending on the service definition and date, and in addition calculate the state and threshold for specific measured value and at the time of the day. For thresholds that are based on cached expression the threshold will be calculate if the data are available in the cache. For more information see the “Bischeck – Installation and administration guide”.
- [FR-254] “Enable to test service in op5 web interface”. This request is not limited to Nagios/OP5, but the capability to on-demand execute a service and its serviceitems in Bischeck. This functionality has been implemented using JMX. The MBean is called com.ingby.socbox.bischeck.service:type=ExecuteServiceOnDemand and have a method with the following signature:boolean execute(java.lang.String host,java.lang.String service)If you using Jolokia as JMX agent a valid call to execute the service sshport for host moon would be:
$ curl http://localhost:7777/jolokia/exec/com.ingby.socbox.bischeck.service:type=ExecuteServiceOnDemand/execute/moon/sshport

{"timestamp":1400018354,"status":200,"request":{"operation":"execute","mbean":"com.ingby.socbox.bischeck.service:type=ExecuteServiceOnDemand","arguments":["moon","sshport"],"type":"exec"},"value":true}
To use the function from Nagios as a check command their are a number of things to consider when implementing a check command (we have not done that, thats your task):- Use the $HOSTNAME$ macro has the host parameter
- Use the $SERVICEDESC$ macros has the service parameter
- Make sure that check command return the same status as the current status since the “real” status will come from Bischeck through the normal passive check and not from the check command. That means that the check command must also use the macro $SERVICESTATEID$ to return the same value so the state is not changed.
- Its also important to understand that the on-demand function will not return any performance data. The MBean only return true if the job could be scheduled and false if the host and/or service name do not exists or that the scheduling fail.
Bugs fixed and important issues
- [TR-257] “No Nagios state on null”. This bug caused no state information to be sent to Nagios if any serviceitems for a service if the serviceitems metrics was null.
- Bischeck is not longer checking if the pid file exist on start up. This was removed since it’s problematic from Java in a standard way determine the pid of the running process. Instead the its now up to the bischeckd script.he
- If many services definitions are configured with aggregation the peek load every hour can be very high. In previous release the schedule was kicked off with a cron definition where the second was set to 0. With 1.1.0 the second field will be set to a random value between 0-59. This distribute the scheduling off aggregation over a interval of a minute.
- The install script with the upgrade option -X will copy existing logback.xml configuration in addition to all configuration files in the etc directory.
Bischeck 1.1.0 release candidate 1 released
Release 1.1.0 is a minor upgrade of Bischeck with some new features. Please send us your feedback if your testing the 1.1.0 release candidate 1.
New features
- Command line utility to explore cache content. Support for full syntax of Bischeck mathematical expression to enable simple testing of threshold expressions and virtual services. For more information see the “Bischeck – Installation and administration guide”.
- Server integration with Librato, https://metrics.librato.com/, is now supported. The server integration with Librato enables Bischeck metrics to be sent to Librato’s cloud monitoring service. For more information see the “Bischeck – Configuration guide”.
- NRDP server integration is supported over SSL. Use the property ssl in the server.xml in the NRDP section to enable SSL. Default is false.
- Support to disable SSL (X.509) certification validation for connection over HTTPS, like NRDP. Set the property disableCertificateValidation in the properties.xml. Disable validation have its risks – you have been warned. The default is false. A more secure way to manage certificates is to create a local keystore for Bischeck, see http://docs.oracle.com/javase/6/docs/technotes/tools/solaris/keytool.html. This will also require setup of additional system properties to java that has to be added in the $BISHOME/bin/bischeck script. Loads of documentation exists on the web.
- Support for Jolokia, http://www.jolokia.org/, for JMX remoting. Jolokia is a jmx agent that support HTTP/JSON access and remove all the problems with the standard JMX agent that use RMI. RMI is especially problematic in any network environment with firewalls. With Jolokia its simple to tunnel the JMX connection over ssh. Jolokia provides fine grain security and access capabilities. The RMI based JMX agent is still the default, but that will change in the future releases of Bischeck. If you like to use Jolokia with Bischeck 1.1.0 just uncomment row 53 and comment row 52 in the $BISHOME/bin/bischeck script. Two additional configuration files has been added to the $BISHOME/resources directory to control the behavior of Jolokia:
- jolokia.conf – basic setting, like port. Read more in the “JVM agent” chapter at http://www.jolokia.org/reference/html/agents.html.
- jolokia-access.xml – define policy based security. More info at http://www.jolokia.org/reference/html/security.html.
- [FR-252] “Adding the hour level to the period definition”. This feature request enable fine grain granularity of the warning and critical level for a specific hour interval.
....
<period>
<months>
<dayofmonth>25</dayofmonth>
</months>
<calcmethod>></calcmethod>
<warning>10</warning>
<critical>20</critical>
<hoursIDREF>101</hoursIDREF>
</period>
....
<hours hoursID="101">
<hourinterval>
<from>00:00</from>
<to>11:00</to>
<threshold>1000</threshold>
</hourinterval>
<hourinterval>
<from>12:00</from>
<to>24:00</to>
<threshold>2000</threshold>
<!-- Override the values from the period section -->
<warning>20</warning>
<critical>30</critical>
</hourinterval>
</hours>
....
Between 00 – 11:59 the warning and critical values in the period section will be used and between 12 and 23:59 the warning and critical “override” values are used. For the threshold between 11 and 12 the linear equation will be used to calculate the threshold value starting at 1000 at 11:00 and 2000 at 12:00, but the warning and critical will in that time interval be the values from the period section. For more information see the “Bischeck – Configuration guide”.
- Testing of thresholds rules has been enhanced. The bin/bischeck threshold.Twenty4HourThreshold command will list the resolved threshold configuration depending on the service definition and date, and in addition calculate the state and threshold for specific measured value and at the time of the day. For thresholds that are based on cached expression the threshold will be calculate if the data are available in the cache. For more information see the “Bischeck – Installation and administration guide”.
- [FR-254] “Enable to test service in op5 web interface”. This request is not limited to Nagios/OP5, but the capability to on-demand execute a service and its serviceitems in Bischeck. This functionality has been implemented using JMX. The MBean is called com.ingby.socbox.bischeck.service:type=ExecuteServiceOnDemand and have a method with the following signature:boolean execute(java.lang.String host,java.lang.String service)If you using Jolokia as JMX agent a valid call to execute the service sshport for host moon would be:
$ curl http://localhost:7777/jolokia/exec/com.ingby.socbox.bischeck.service:type=ExecuteServiceOnDemand/execute/moon/sshport

{"timestamp":1400018354,"status":200,"request":{"operation":"execute","mbean":"com.ingby.socbox.bischeck.service:type=ExecuteServiceOnDemand","arguments":["moon","sshport"],"type":"exec"},"value":true}
To use the function from Nagios as a check command their are a number of things to consider when implementing a check command (we have not done that, thats your task):- Use the $HOSTNAME$ macro has the host parameter
- Use the $SERVICEDESC$ macros has the service parameter
- Make sure that check command return the same status as the current status since the “real” status will come from Bischeck through the normal passive check and not from the check command. That means that the check command must also use the macro $SERVICESTATEID$ to return the same value so the state is not changed.
- Its also important to understand that the on-demand function will not return any performance data. The MBean only return true if the job could be scheduled and false if the host and/or service name do not exists or that the scheduling fail.
Bugs fixed and important issues
- [TR-257] “No Nagios state on null”. This bug caused no state information to be sent to Nagios if any serviceitems for a service if the serviceitems metrics was null.
- Bischeck is not longer checking if the pid file exist on start up. This was removed since it’s problematic from Java in a standard way determine the pid of the running process. Instead the its now up to the bischeckd script.he
- If many services definitions are configured with aggregation the peek load every hour can be very high. In previous release the schedule was kicked off with a cron definition where the second was set to 0. With 1.1.0 the second field will be set to a random value between 0-59. This distribute the scheduling off aggregation over a interval of a minute.
Bischeck mail lists online
The mailing lists for Bischeck users and developers are now available at https://www.monitoring-lists.org/.
Thanks to Holger Weiss to hosting our mail lists.
Bischeck 1.0.2 released
Release 1.0.2 fix a bug in 1.0.1 so if you are on 1.0.0 or 1.0.1 upgrade . Please see the release note and find the new release here.
Read about how Nagios XI can be configured with Bischeck
Check out the Nagios Enterprise article “How to Integrate the Bischeck Plugin Extension with Nagios XI”.
Bischeck 1.0.1 released – fix a major bug in threshold management
Release 1.0.1 fix a major bug in 1.0.0 so if you are on 1.0.0 upgrade asap. Please see the release note and find the new release here.
Thanks to Pasquale Settanni to reporting this bug.
Bischeck 1.0.0 released
Finally we got Bischeck 1.0.0 out. Hopefully you will find 1.0.0 a major improvement over previous release. To see whats new in 1.0.0 please visit the previous posts about RC1 and RC2. The documentations has been updated to reflect the new stuff in 1.0.0. You should also check out the release note before for you start upgrading from 0.4.3 which is the only previous version that is supported for upgrade.
Thanks to everybody that has tested this version. A special thanks goes to Pasquale Settanni at Eutelsat Broadband for his testing effort and valuable feedback.
As usual we look forward to your feedback.
Bischeck builds on Cloudbees
Bischeck is now available at Cloudbees. You can checkout the last status of the build from our trunk at our Jenkins site on Cloudbees. Any build should be regarded as unstable and should not be used in production.
Thanks to the good folks @cloudbees to support FOSS software development. To get more info about their FOSS program please visit here.
Bischeck 1.0.0 RC2 is available
Hopefully this is the final release candidate before its time for the real version 1.0.0 of Bischeck. We still lacking the new manuals, but we will do the best to get it out as soon as possible.
Thanks to everybody that has tested RC1. A special thanks to Pasquale Settanni at Eutelsat Broadband for his testing effort and valuable feedback.
Bischeck 1.0.0 RC2 can be downloaded from here. To read what is already in RC1 check out this post.
Hope you will enjoy the final release candidate and as always, feedback is appreciated. Continue reading Bischeck 1.0.0 RC2 is available
Need for a Bischeck logo
We are in desperate need for a logo for Bischeck. Anybody out there with graphical design skills that would like to make a logo under an open license? Send a email at bischeck@ingby.com if you are interested.
