Contents
Introduction
Performance testing is key to secure that your software can handle the load and to verify the robustness of the software. With server based software, running as a daemon, it is especially important to verify that the software is stable during a long period of continues uptime without decreased throughput and by leaking resources, like memory.
Since bischeck is designed to do advanced service check with dynamic and adaptive thresholds we know that cpu and memory will be important resources when operating with mathematical algorithms over historical collected data.
The test setup will start with a baseline that is scaled in two dimensions, increase the load by increase the number of service jobs and increase the load by decrease the interval between service job schedules.
The goal
The goal with the test was to get an understanding how bischeck perform from a scalability and stability point of view with a large scale configuration and with a high execution rate.
- Scalability – how the system scale with increased/decreased load and how the scalability is depending on the parameters that increase/decrease the load, like number of service, scheduling interval, etc.
- Stability – continues throughput and stable resources utilization running over a long period of time.
In a Java environment the stability focus is key to secure the resource utilization of classes, objects and threads and verify that no memory leaks exists, so your process end up with an “out of memory” exception.
Configuration
A configuration of 3000 service jobs will serve as a base line. A service job is defined as unique host, service and service item entry in the bischeck.xml configuration file, where each host has one service and each service has one configured serviceitem. Each service will connect to bischeck’s internal cache and the corresponding serviceitem will do an average calculation of the 10 first cached elements collected by the previous serviceitem in the configuration.
To get initial data into the bischeck historical data cache, we will have a service that use the normal Nagios check_tcp command to retrieve response time data of the ssh server port on the localhost. This will run every 5 second. The configuration for the check_tcp job is:
XML |copy code |?
01 <host>02 03 <service>04 05 06 07 <serviceitem>08 09 10 11 12 </serviceitem>13 </service>14 </host>
For the rest of the 3000 configurations we will have the following configuration structure in the bischeck.xml file:
XML |copy code |?
01 <host>02 03 <service>04 05 06 07 08 <serviceitem>09 10 11 12 13 </serviceitem>14 </service>15 </host>16 <host>17 18 <service>19 20 21 22 23 <serviceitem>24 25 26 27 28 </serviceitem>29 </service>30 </host>31
This structure is repeated for each ten hosts in the configuration.
The threshold logic is setup in a structure with an unique
XML |copy code |?
01 <servicedef>02 03 04 05 <period>06 07 08 09 10 </period>11 </servicedef>12 13 <hours hoursID="101">14 15 16 17 18 19 20 21 </hours>
The objective of the test configuration is to scale up every part of the bischeck system and a distributed access to configuration and cache, without benefits of any type of memory caching.
For the complete configuration files please see here.
Design changes
The initial performance tests showed three areas of bad behavior that required minor redesigning:
- Memory leaks related to class loading when doing reload of bischeck. Bischeck has the capability to do a configuration reload of the running bischeck process. The reload is executed of JMX and used from bisconf, the web based configuration UI, to deploy new configurations. The reload is done without restarting the bischeck process. Every time reload was done the issue was that all classes loaded with reflection was reloaded. In the long run this would end up with the Java permgen space would get an “out of memory” exception. This was fixed by implementing a class cache.
- Bischeck use the mathematical package JEP to calculate thresholds. The existing solution was that each threshold object had its own JEP object. What became clear was that the JEP object is very resource intensive. Since it not used very often per threshold, depending on scheduling time, we chose to implement a pool of JEP objects that could be used between all threads executing JEP logic. The pool will grow on demand, but the memory utilization is dramatically decreased without a contention between the using threads.
- Use of timers down on each service job and threshold execution. On a 3000 service jobs system, gave a result of +6000 counters. Even if the Metrics package from http://metrics.codahale.com/ is great, it became to much for the jvm. Instead the timers was reduced to show the aggregated counters for all services and all thresholds, which will enhance the monitoring from an overview perspective.
The baseline test will run 3000 unique host, service and service items at 30 second interval and one (check_tcp) at a 5 second interval. This means we expect to have a service job rate at 100,2 per second including service and threshold logic.
The cache size is set to 200. For a 3000 services we will store at least 600200 collected items in the cache. Since the cache in 0.4.2 is only stored on the jvm heap this is the main parameter that what drives the memory utilization.
Test system
The tests was run on my “reasonable priced laptop” , a Lenovo 430S with a Intel Core i7 3520M 2,9 GHz, 8 Gbyte memory and a 180 Gbyte SSD disk running Ubuntu 12.04. The processor is dual core and support hyper threading so it’s presented as 4 processor system. Cpu utilization reported from the tests is the percentage of the total 4 processors.
The Java environment is the standard from the Ubuntu repository, OpenJDK 64-Bit Server VM (20.0-b12, mixed mode) and java version 1.6.0_24. In none of the tests did we change any jvm parameters from the standard.
Test 1 – Baseline
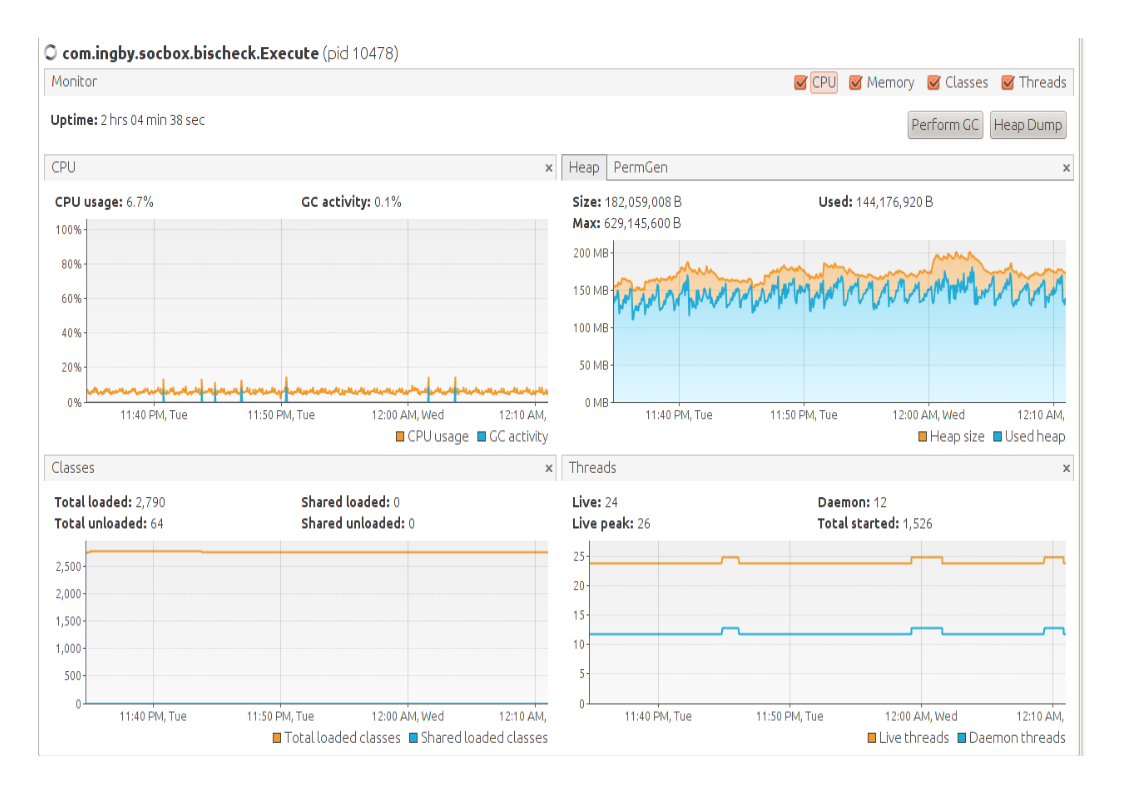
3000 service jobs with 30 sec scheduling interval
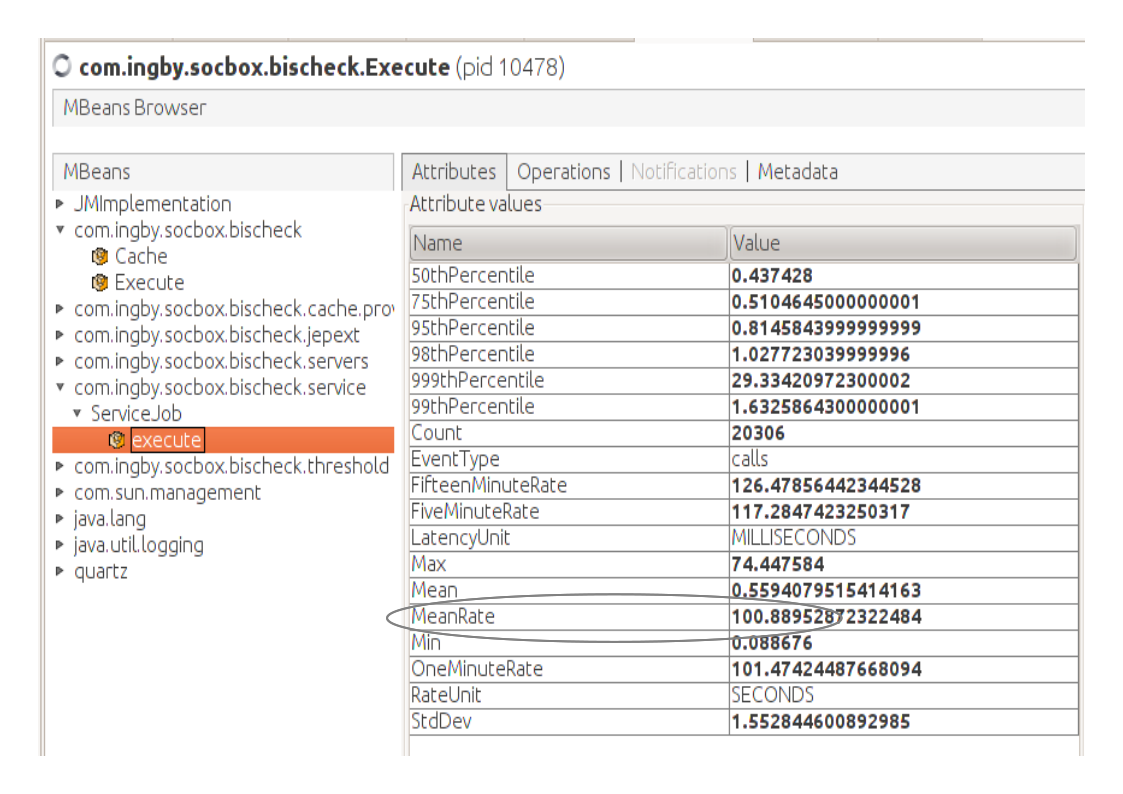
With 3000 service jobs (plus one check_tcp) configured we expect 100,2 service jobs executions/second.
Using your preferred JMX client you can verify the execution rate by checking the number of “execute” for the ServiceJob.
The test runs until we reach a steady state of cache population of 200 cache items per service resulting at a total of 600 200 cache objects on the heap. The test uses an average of 7 % processor utilization and heap memory around 145 Mbyte.
Through the JMX enabled timers, the total execution time for a service job, executing service and threshold, takes on average 0.8 ms.
Test 2 – Decrease scheduling interval
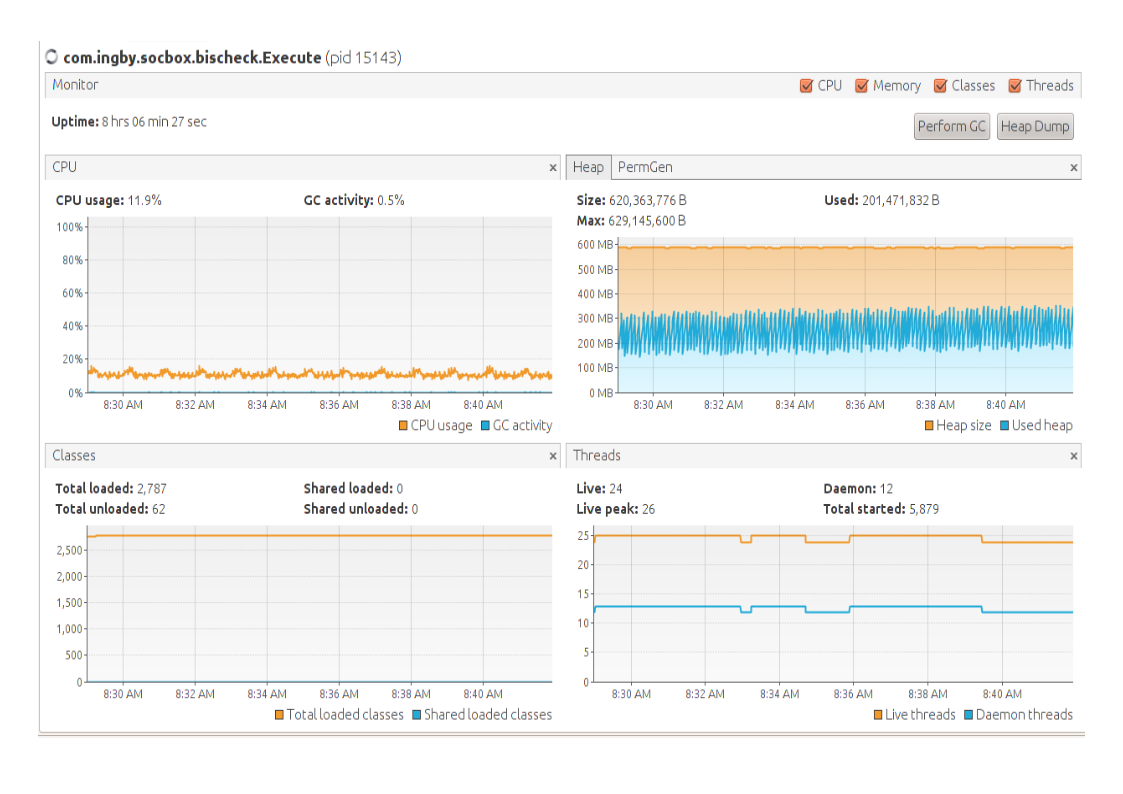
3000 service jobs with 15 sec scheduling interval
The difference from the first test is that the processor utilization is increased to an average of 12% and that the throughput has increased to 200 service jobs per second. Heap memory has increased to an average of 250Mbyte, even though we have the same amount of cache objects on the heap. This is probably related to the increased throughput and garbage collection execution.
Test 3 – Increase number of service jobs
6000 service jobs with 30 sec scheduling interval
Processor utilization is on the average the same as the previous test, which was expected. Heap memory is almost doubled to an average of 500 Mbytes, which was also expected since we now have a total of 1 200 400 cache objects on the heap. Throughput is still the same as in the previous test, 200,2 service job executions per second.
Scalability is according to expectations.
 Test 4 – Push the limits
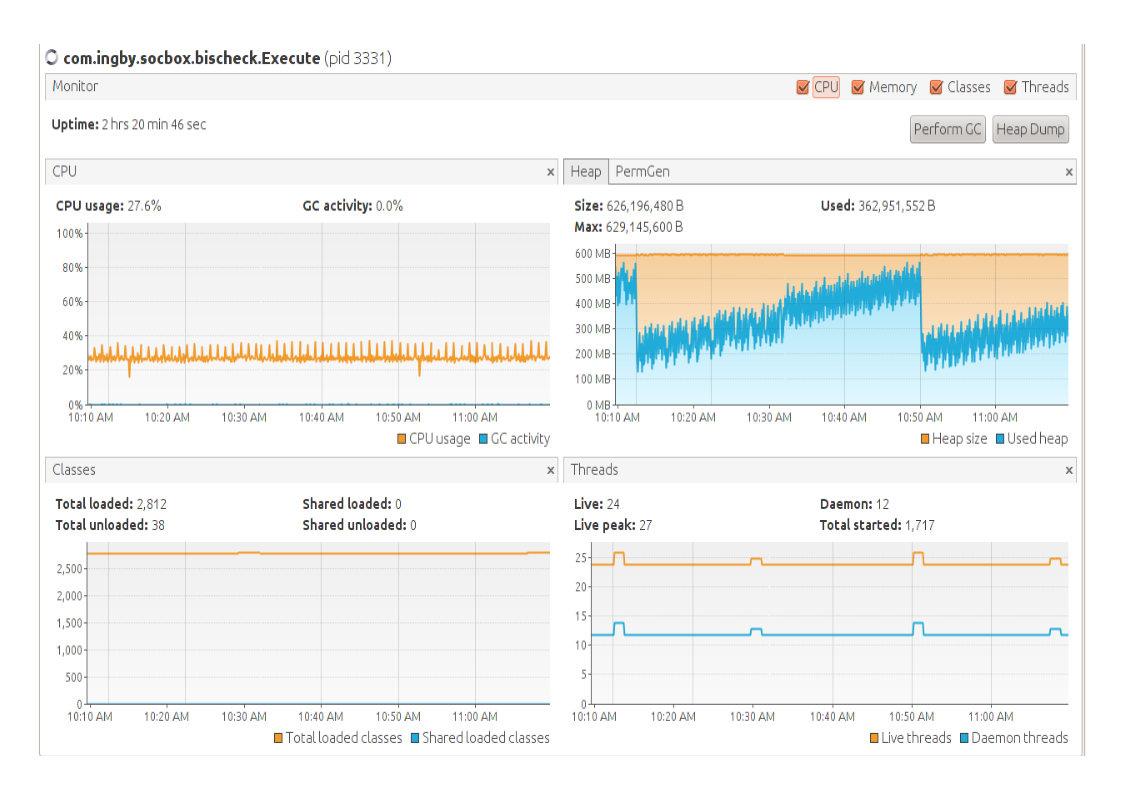
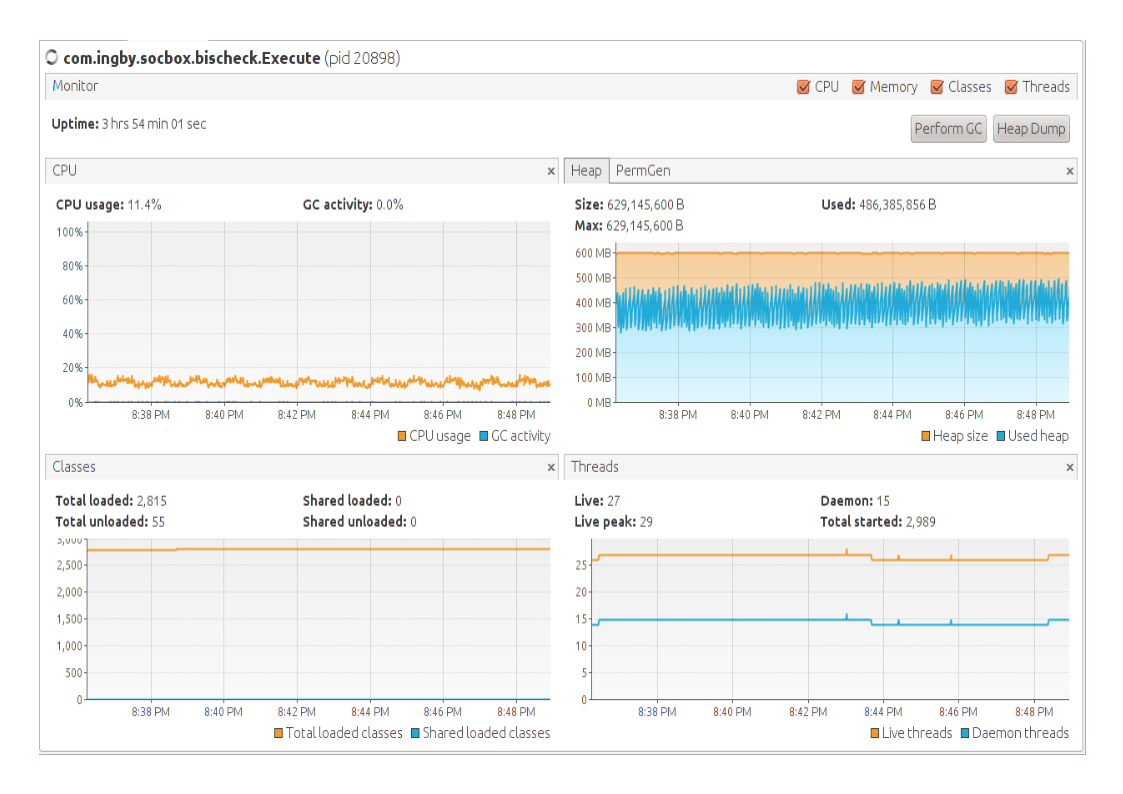
3000 service jobs with 5 sec scheduling interval
In the final test we pushed the number of service jobs executed per second up to 600. The problem we first encountered was that our locally running nsca daemon (running in single mode) could not manage the load and started to reject connections. Since the tests are not primarily a test of nsca we shutdown nsca to enable bischeck receive a connection failure, instead of a connection timeout, and continue. With this change we could push throughput up to 540 executed service jobs per second, before hitting the bottleneck of the synchronization of the server class (nsca) send method. Still, 540 executions per second would compare to 180 000 service jobs running on 5 minute interval, but then memory would be a different challenge.
Even if we currently do not see many situations where this throughput is demanded this will be addressed this in future versions, considering server connection pooling, buffered sends, etc.
Cpu utilization is on average 28%, almost 3 times from 3000 with 15 seconds scheduling interval which show a linear increase of the load.
Summery
The results are promising and is showing that bischeck can handle a high number of service jobs with high throughput, without leaking resources. The current design with keeping all historical data in a cache located on the heap is something that we in future versions will redesign to relax the amount of heap memory needed to manage large amount of historical data. The current server integration do also impose some limitations that should be addressed in coming releases.
