Thanks to Rahul Amaram we where made aware of a big performance bottleneck in Bischeck 1.1.0. Rahul’s use case was that he need to keep around 15000 metrics for each service definition in the cache to create thresholds. When calculating the threshold he used time based queries, but when the cache size grow on an individual service definition the cpu utilization started to increase both for the bischeck java process and the redis server.
To resemble Rahul’s use case we used a server with 4 cores (Intel Core i7 4510U 2 GHz) and 16 Gbyte memory where we configured 10 service definitions that collected metrics every second. In the cache each service definition was configure to have 15000 metrics items, around 4.2 hours of historical data. The threshold calculation for each service definition had the following statement:
avg($$HOSTNAME$$-$$SERVICENAME$$-$$SERVICEITEMNAME$$[-10M],
$$HOSTNAME$$-$$SERVICENAME$$-$$SERVICEITEMNAME$$[-20M],
$$HOSTNAME$$-$$SERVICENAME$$-$$SERVICEITEMNAME$$[-30M],
$$HOSTNAME$$-$$SERVICENAME$$-$$SERVICEITEMNAME$$[-40M],
$$HOSTNAME$$-$$SERVICENAME$$-$$SERVICEITEMNAME$$[-60M],
$$HOSTNAME$$-$$SERVICENAME$$-$$SERVICEITEMNAME$$[-90M],
$$HOSTNAME$$-$$SERVICENAME$$-$$SERVICEITEMNAME$$[-120M],
$$HOSTNAME$$-$$SERVICENAME$$-$$SERVICEITEMNAME$$[-150M],
$$HOSTNAME$$-$$SERVICENAME$$-$$SERVICEITEMNAME$$[-180M])
So every time the threshold logic is executed Bischeck fetch 9 values with a time based query.
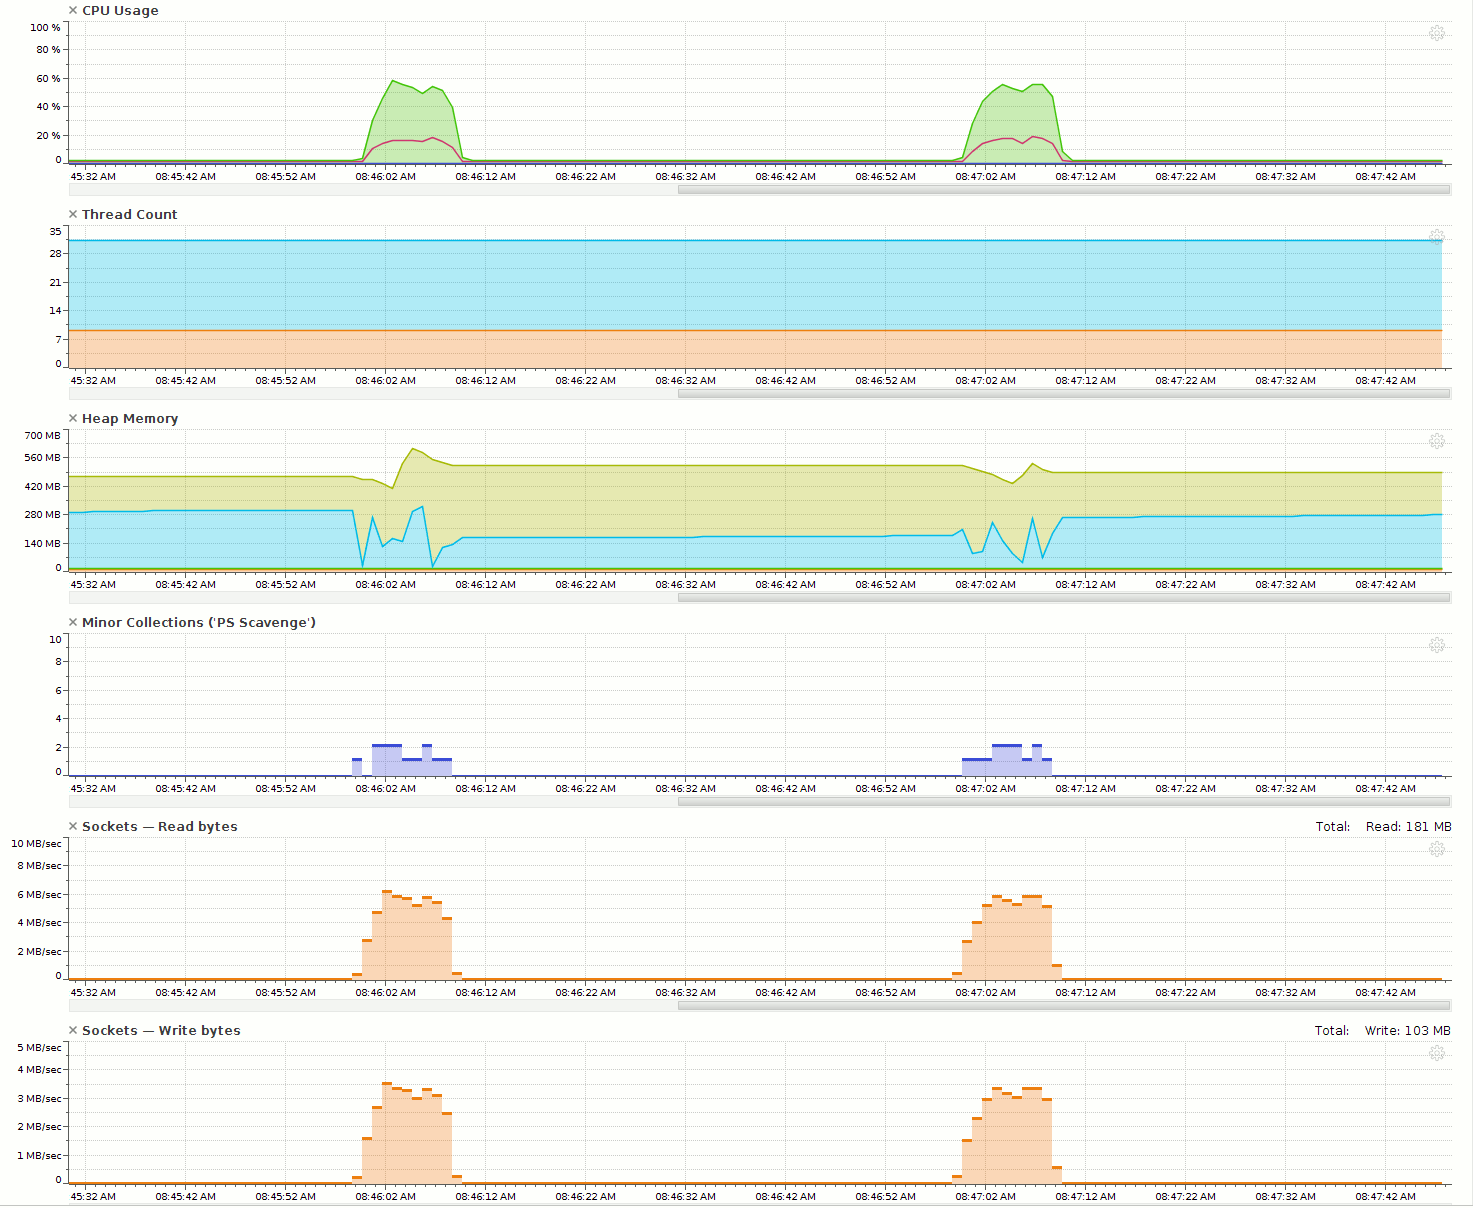
When we started to run the test and filled it with 15 000 items for each service definition, totally 150 000 items in the cache, we saw the below utilization behavior.
 The peek every 60 seconds could quickly be related to the internal logic of the Twenty4HourThreshold class.The class recalculate the threshold every 60 second, if the service is schedule for less then 60 seconds. But why the horrible performance?
The cpu utilization for the jvm was at the peek (user + kernel) 58 % and the socket read was peeking against 6 Mbyte/sec. Using top we saw that Redis in the same interval was up to 25 % cpu utilization. Since the cpu percentage is on the total, 25 % means utilizing one cpu core. Redis is known to be blazing fast and even if its’s single threaded, so we could not start with blaming Redis. Normally the problem is in the code we write, which is usually a surprise to developers.
When Bischeck store metric data in Redis we use a linked list, one linked list for each service definition. This is simple since the newest data is just pushed on the list head and purged from the tail. A query by index is simple to do, but when we use a query by time we need to search the list to find the index which has a timestamp “closest” to our search criteria, like which index is “closest to 60 minutes ago”. After a quick check in the code we could see that we where doing a sequential search from the beginning of the list. This worked “okay” prior to version 1.0.0 since the cache size was normally around a thousand and the cache was on the java heap. Now we have 15000 and to find the -180M we have to go through almost 75% (11250 items) of the list to find the data. That means 11250 reads against Redis just to find one item.
The solutions was not that difficult, use a binary search. That gave an average of 10-14 searches before it found the right item in a list of 15000 items. For the same configuration we now got a very different performance utilization.
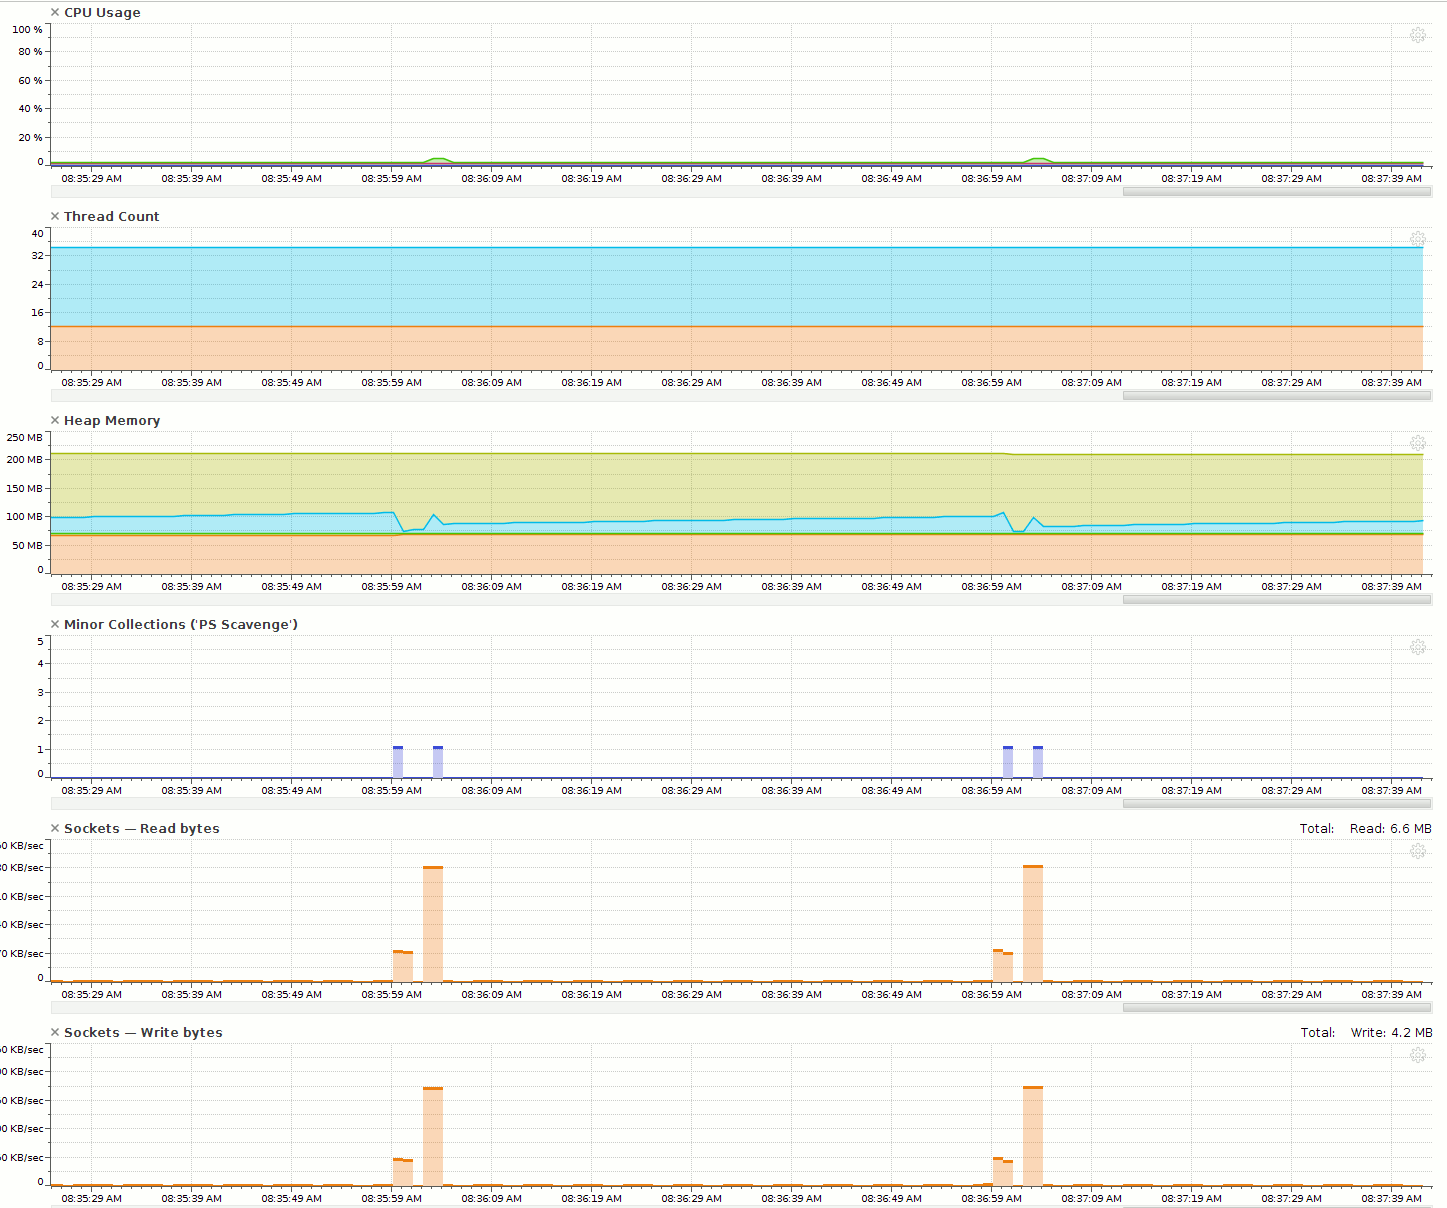 The cpu peek utilization is now around 5% and for the Redis server it peeks at 3% and with a read peek of 270 KB/sec. The interval of high utilization is now minimal to the first test. For time based queries on large cache lists this is a great performance increase.
Performance will vary depending on use cases but if you use time based query and have performance issues you will definitely gain on upgrading to Bischeck 1.1.1.
In the future we will look into using a sorted set in Redis as a complement to the linke list, where the timestamp will be used as the score. This will be like adding an index to a table. There is maybe an opportunity to use different search algorithms depending on list size.
Thanks to Yourkit that support the Bischeck project with excellent profiling tools.
