Bischeck
-
Configuration guide
Version 1.1.0
2014-06-16
Legal Notice Copyright
© 2013-2014 Ingenjörsbyn AB.
This document is licensed by Ingenjörsbyn AB under the Creative Commons Attribution-ShareAlike 3.0 Unported License, http://creativecommons.org/licenses/by-sa/3.0/. If you distribute this document, or a modified version of it, you have to provide attribution to Ingenjörsbyn AB and provide a link to the original.
Linux® is the registered trademark of Linus Torvalds in the United States and other countries.
Java® is a registered trademark of Oracle and/or its affiliates.
Nagios® is an official trademark of Nagios Enterprise Inc.
All other trademarks are the property of their respective owners.
Abstract
This guide provides information about how to configure Bischeck. For tasks related to installation and administration, see the “Bischeck - installation and administration guide”.
Table of Contents
1 Introduction
Monitoring and surveillance is today standard in any IT operation. The market is mature and a number of excellent solutions exist, especially in the open source market. The major limitation is that the current solutions predominately only work with single entities of data, “check response time of web service xyz”, and static thresholds, “response time lower then 100 ms for xyz is okay”.
This limitation becomes very obvious when trying to monitor something that is a little bit more complicated like monitoring business processes and applications, but is also applicable for normal IT infrastructure monitoring. This type of monitoring requires that we can set the data we collect into a context, both with historical data and with data from different sources. Let us say we would like to monitor the ratio between CPU utilization of the server and the number of order transactions processed by our webshop. We expect that we need a monitoring system that in addition to just absolute values is able to manage:
- Percentage change
- Rate of change
- Ratios
- Deviations from a calculated baseline
- Trends over time
- Forecasting
The second aspect of monitoring is to determine if the monitored data is within the boundaries of what is expected. The capability to set and define thresholds is key to get the “correct” alarms. The static way to define thresholds is not enough. Trying to find one value that is the correct in all situations and at all times is impossible. The risk is that we will just get to many or to few alarm notifications.
To enable advanced monitoring Bischeck supports the following features:
- Support for dynamic and adaptive thresholds.
- Support for dynamic configuration of thresholds depending of time of the day and day of week or month.
- Support for thresholds based on fixed values as well as thresholds based on measured data from other services. This is typical for process driven businesses.
- Support for mathematical functions to calculate thresholds based on historical data.
- Predictive based mathematical operations like Linear Least Square to calculate trend based thresholds.
- Historical data cache for all measured services that can be retrieved based on index and time. Historical data is the main source to calculate dynamic and adaptive thresholds. The cache is persistent between starts and stop of Bischeck. Since version 1.0.0 the cache is implemented using Redis, http://www.redis.io.
- Support for multiple scheduling schemas per services. This enables a fine grained control of when a service should be run. Bischeck supports interval scheduling, cron scheduling and service relation based scheduling.
- Support for “virtual” services that is based on calculation from data from multiple sources. This enables monitoring for ratios, trends, forecasting, etc.
- Support for a multitude of ways to connect to source systems by allowing custom developed service connection methods.
- Support for custom threshold classes to enable any way to define threshold logic.
- Integration with multiple monitoring and surveillance tools, like any Nagios based systems that supports the Nagios Service Check Acceptor (NSCA), the Nagios Remote Data Processor (NRDP) protocol and Livestatus, [A] [A] Nagios Core, Nagios XI, Icinga, OP5 Monitor, Shinken, Opsview, Centreon, NetEye, Naemon,etc., as well as systems such as OpenTSDB and Graphite.
Let us look at 3 examples that can be solved using Bischeck:
Example 1 – Monitor the number of orders received during the day
Example 1 – Monitor the number of orders received during the day
The order management application receives orders 24 hours a day during Monday to Friday. The total aggregated number of orders varies as a function of the time of the day. The business expects to have a total number of orders of 1500 at 13:00, at 14:00 the order count should be 2300, at 15:00 it should be 3400, etc. Between every hour the business requirement is to interpolate the order rate according to a linear function between the defined hour rates. This means that the threshold at 13:20 is (2300-1500)*20/60+1500 = 1767. The warning alarm level should be between 90% and 70% of the threshold and the critical alarm level is reached if the measured value is below 70% of the threshold.
Example 2 – Monitor the number of created invoices in relation to the number of received orders
Example 2 – Monitor the number of created invoices in relation to the number of received orders
The invoicing system should invoice at least 80% of the daily incoming orders in the same day, with a maximum of one hour delay. This means that the measured value of orders with one hour delay must be used as a threshold for the number of created invoices.
Example 3 – Monitor if we will run out of disk space in the next 40 days
Example 3 – Monitor if we will run out of disk space in the next 40 days
A typical threshold for disk utilization is defined like 90% of the total space. This is of course important but it could be equally important to understand the growth speed of the disk utilization, such as if the size has grown with 5% or more since yesterday. To enable early better information on when to purchase additional disk storage, we need to get an alarm if the predictive trend of growth will pass our 90 % utilization level in the next 40 days.
Hopefully, these examples have convinced you that Bischeck can do complex monitoring by advanced threshold management including process dependencies, independent of if you monitor business, application or system metrics. The image below describes how Bischeck monitoring can be achieved when integrating it with your existing IT surveillance infrastructure.
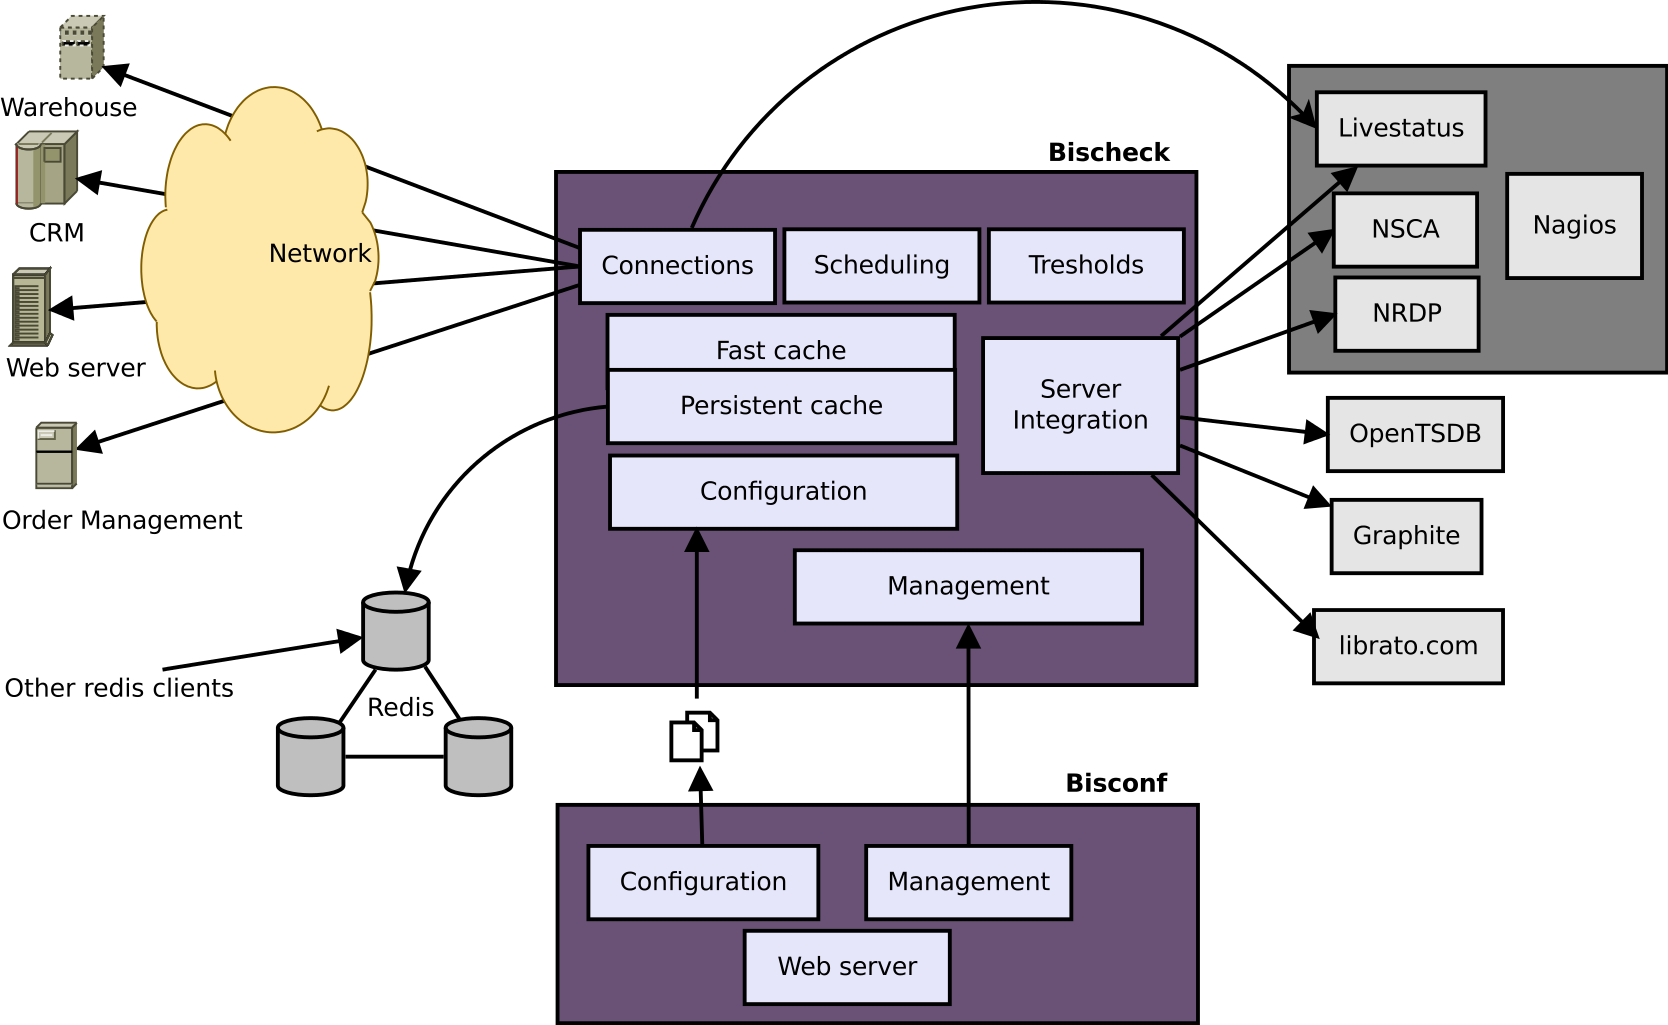
- Configuration - Manage all configuration of Bischeck
- Scheduling - Controls the execution time of each service
- Connection - Manage connections to the source systems to monitor
- Threshold - Manage the threshold configuration and processing
- Cache - Storage of historical data collected from the source systems
- Server integration - Manage integration and formatting to the different monitoring systems
Bisconf is an optional web tool that provides editing management of the Bischeck configuration files. In addition, it provides life cycle management to deploy new configurations and start and stop the Bischeck processes.
Bischeck and Bisconf are open source and licensed under GPL version 2. Bischeck and Bisconf are written in Java,run as stand-alone daemons and integrate with different monitoring and surveillance tools over open protocols. If you have ideas to new features, find bugs, etc, please visit http://www.bischeck.org where you can create bug reports and feature requests. You can also email bischeck@ingby.com. We look forward to your feedback.
2 Configuration concept
The design of Bischeck is based on 3 main configuration entities:
- Service definitions - the configuration of what is to be monitored. The service definition is defined as host, service and service items
- Thresholds - the threshold configuration for a specific service definition
- Servers - the configuration of the servers where the monitored data should be sent
As an example we have host erpserver. The erpserver server has two services that need to be monitored, orders and invoices. For the order service, we have 2 different kind of order types that need to be monitored, ediOrders and mailOrders. If there are any problems with either ediOrders or mailOrders we need an alarm from the service orders. The service defines the connection URL to instantiate the right service class to manage the connection. For example, if the URL has a schema name that is jdbc, the JDBCService class is used [B] [B] The mapping between schema name and service class is done in the configuration file urlservices.xml, see urlservice.xml ↓. For more information about uri structure please visit http://en.wikipedia.org/wiki/URI_scheme.. The service in our example will have two serviceitems, one per order type, defining the statements to be executed to retrieve the monitoring data. If the connection for the service is jdbc, the serviceitems can execute SQL statements to collect data. The serviceitems also define the threshold class to be used to calculate the severity of the collected data. The severity levels in Bischeck are OKAY, WARNING, CRITICAL and UNKNOWN [C] [C] The severity is the same as in the Nagios specification. The execution statement configured for the serviceitem can only return a single, numeric value.
To summarize, a host can have multiple services, each service can have multiple serviceitems and the state of the service is always the state of the serviceitem that resolved to the highest severity level.
Each service definition must be unique in a Bischeck configuration. The data collected per service definition is stored in Bischeck’s cache and can be queried by its name when used in threshold calculations and virtual services.
When threshold evaluation is done for a service definition, the monitoring data, including state, performance data and threshold, is sent to all the configured servers.
All configuration is described in xml files located in the etc directory of the installation, refereed to as $BISHOME in this document.
3 Service definition - hosts, services and serviceitems
As described in the previous chapter the service definition is defined as a host, service(s) and serviceitems. The host configuration acts only as a name space container and does not provide anything but the name and alias. A host can have one or multiple services and each service can have one or multiple serviceitems. The key attributes of the service are the service name, the schedules describing when to execute the service and the URL connection that defines the protocol to connect to the data to monitor.
The serviceitem key attributes are the execute statements, defining what should be executed to retrieve the data that is subject to monitoring, and the threshold class used to calculate and validate the state of the measured data.
3.1 Services
The following service classes are provided in the standard Bischeck distribution.
3.1.1 JDBC
The JDBCService manages connections to databases over JDBC. JDBC driver jars must be stored in the directory $BISHOME/customlib to be loaded automatically at start-up. No JDBC drivers are provided with the Bischeck distribution.
A JDBC connection is described with a normal jdbc URL and with an additional driver class name in the Bischeck configuration file.
3.1.2 Livestatus
The LivestatusService enables connectivity to any Nagios server supporting MK Livestatus [D] [D] More information on MK Livestatus can be found on http://mathias-kettner.de/checkmk_livestatus.html. A livestatus connection is specified with a URL with the following format:
livestatus://hostname:port
The requirement for this type of connection is that livestatus is configured as a xinetd service on the server running livestatus and Nagios. To configure livestatus with xinetd please see “Remote access to Livestatus via SSH or xinetd”.
3.1.3 Bischeck cache
The LastCacheService enables connections to Bischeck’s historical data cache where the measured data is stored. With this service, any existing service definition (host-service-serviceitem) can be retrieved from the cache. This is typically used to create virtual services based on mathematical expression to combine cache data entities. The connection URL for the Bischeck cache is:
bischeck://cache
3.1.4 Shell
The ShellService enables execution of programs and scripts on the localhost. The connection URL for the shell service is:
shell://localhost
3.2 Serviceitems
The following serviceitems classes are provided in the standard Bischeck distribution.
3.2.1 SQL
The SQLServiceItem enables execution of a SQL statements. It is important that the SQL statement only return one single numeric value, like a "select count(*) ...." or “select sum(orderValue) from ....”.
The SQLServiceItem can be used with the service URL matching jdbc://.
3.2.2 Livestatus
With the LivestatusServiceItem, both state and performance data can be queried for a Nagios service. The query is formatted as a json structure. To query a specific Nagios service state, the following statement example can be used:
{"host":"linux-server1","service":"DNS","query":"state"}
The above will query the current Nagios state of service DNS for host linux-server1.
To query the performance data for the Nagios service HTTP, just change the query key value to perfdata and add the label key so the right label in a multi value performance data is retrieved:
{"host":"linux-server1","service":"HTTP","query":"perfdata","label":"size"}
The LivestatusServiceItem can be used with the service URL livestatus://hostname:port.
3.2.3 Cache calculations
The CalculateOnCache serviceitem class enables statement execution using data from the historical cache and mathematical functions, Mathematical expressions on cache data↓. With this capability, powerful expressions can be created on the cached data like:
avg(erpserver-orders-ediOrders[0:9])
The above example will calculate the average of the last 10 collected data entries in the cache for the service definition "erpserver-orders-ediOrders".
Ratios can be created using data from different service definitions like:
avg(erpserver-orders-ediOrders[0:9])/avg(erpserver-orders-webOrders[0:9])
The CalculateOnCache can be used with the service URL bischeck://cache.
3.2.4 Check commands
With the CheckCommandServiceItem class, performance data can be retrieved by executing a Nagios check command. [E] [E] Nagios check commands are also called Nagios plugins. A check command must follow the Nagios Plugin development guideline, http://nagios-plugins.org/doc/guidelines.htmlThe check command that is executed must output performance data according to the Nagios specifications for the CheckCommandServiceItem to work. The exec statement query is formatted as a json structure. To execute a check command and retrieve specific performance data, the following statement example can be used:
{"check":"/usr/lib/nagios/plugins/check_tcp -H moon -p 22","label":"time"}
The above will execute the check_tcp program and retrieve the performance data with label time.
The benefit of using a check command from Bischeck would be if there is a need to manage the performance data with dynamic thresholds that is not possible in Nagios.
Note that there is no management of environment variables through Bischeck when executing a check command.
The CheckCommandServiceItem class can be used with the service URL shell://localhost.
4 Service definition cache
Bischeck keeps a cache of the measured data points for every service definition. The cached data can be used in the execute statements of serviceitems, like CalculateOnCache, to create virtual services and in threshold classes to create dynamic and adaptive thresholds, see section Twenty four hour threshold ↓.
The number of items per service definition that will be kept in the cache is configured per service definition, see bischeck.xml ↓. If not specified, the default size used is set by the property lastStatusCacheSize, see properties.xml↓.
4.1 Methods to retrieve cache data
There are a number of ways to retrieve data from the cache. The cache supports both retrieval by index or by time and the retrieval can be done for a single element or to a list of elements.
4.1.1 Retrieve single cache data element by index
To retrieve a single data element from the cache, the following format is supported:
host-service-item[X]
Where X is the index in the cache for the service definition. Index 0 will always return the last stored data for the service definition, e.g. erpserver-orders-ediOrders[0].
4.1.2 Retrieve single cache data element by time
Data can also be retrieved from the cache by using a time offset. This will retrieve the data for the service definition closest to the specified time offset. The supported format is:
host-service-item[-XS]
host-service-item[-XM]
host-service-item[-XH]
X is the time and S (seconds),M (minutes) or H (hour) define the resolution of X. For example the expression erpserver-orders-ediOrders[-30M] will retrieve the data for the service definition closest to 30 minutes ago.
4.1.3 Retrieve a list of cache data elements by index
For mathematical functions that operate on a list of elements, like sum, avg and max, Bischeck supports two methods to retrieve a range of elements by index. The first method defines a “from-to index”, like erpserver-orders-ediOrders[0:9] that will retrieve all cache elements from index 0 to 9 as a list separated by comma (,). [F] [F] The choice of comma (,) as separator character is due to the fact that this is the separator character used by JEP functions that take a list of values.
sum(erphost-orders-ediorders[0:9])
This will calculate the sum of the last 10 cached elements for erpserver-orders-ediOrders.
The second method is to define a list of indexes that do not need to be in sequence, like erpserver-orders-ediOrders[1,3,5] that will retrieve the elements for index 1, 3 and 5 as a list separated by “,”.
sum(erphost-orders-ediorders[1,3,5])
4.1.4 Retrieve a list of cache data elements by time range
To retrieve a list of data elements based on a time range, the expression has the format erpserver-orders-ediOrders[-30M:-120M]. This will retrieve a list of all elements that exist in the cache between 30 minutes to 120 minutes ago. The time operator supported is the same as for single data elements.
4.2 Mathematical expressions on cache data
In places where cache data can be used, like thresholds and for some serviceitems, it is possible to use mathematical expressions on the data. In Bischeck we use the mathematical package JEP to evaluate mathematical expressions and formulas. Let us look at some examples.
erphost-orders-ediorders[0] / erphost-orders-ediorders[-30M]
This example will divide the last cached data, index 0, for erphost-orders-ediorders with the cached data of erphost-orders-ediorders 30 minutes ago.
max(erphost-orders-ediorders[-5M], erphost-orders-ediorders[-10M], erphost-orders-ediorders[-15M])
In the above the highest value will be returned of the cached data for erphost-orders-ediorders cached 5, 10 and 15 minutes ago.
Conditional expressions are supported through the if statement
if((erpserver-orders-ediOrders[0] - erpserver-orders-ediOrders[1]) < 0,0, erpserver-orders-ediOrders[0] - erpserver-orders-ediOrders[1])
The above example checks if the result of "erpserver-orders-ediOrders[0] - erpserver-orders-ediOrders[1]" is less then 0. If true, return 0 and if false return the result of "erpserver-orders-ediOrders[0] - erpserver-orders-ediOrders[1]". The value to use from the cache is defined by an index [X], where 0 is the latest value retrieved for the specific host-service-item.
For more information of all functions that can be used please visit http://www.cse.msu.edu/SENS/Software/jep-2.23/doc/website/doc/doc_usage.htm.
Custom mathematical functions can be developed by following the JEP standard. Please see the “Bischeck installation and administration guide” on how to deploy custom JEP functions with Bischeck.
4.2.1 JEP standard functions
The standard JEP functions supported are:
- round(x,y) - rounding the value of x to y number of decimals.
- ceil(x) - calculate the ceiling value of x.
- floor(x) - calculate the floor value of x.
- abs(x) - calculate the absolute value of x.
- mod(x,y) - calculate the modulus of x % y.
- sqrt(x) - calculate the square root of x.
- sum(x1,x2,x3,.....) - calculate the sum of the list of values.
- ln(x) - calculate the natural logarithm of x.
- log(x) - calculate the logarithm base 10 of x.
- exp(x) - calculate the exponential value of x.
- pow(x,y) - calculate the x as the power of y.
- rand() - random value between 0 and 1
- if(cond, trueval, falseval) - if the cond expression is true trueval is returned, if false falseval is returned.
4.2.2 JEP extensions
With JEP it is easy to create additional functions. With Bischeck, the following functions has been added as part of the distribution.
- avg(x1,x2,x3,...) - Calculate the average of the list of numbers.
- max(x1,x2,x3,...) - Calculate the max value of the list of numbers.
- min(x1,x2,x3,...) - Calculate the min value of the list of numbers.
- multNull(x1,x2,x3,...) - Multiply the numbers in the list. If any of the numbers are null, the function will return null.
- divNull(x1,x2) - Divide the numbers. If any of the numbers are null the function will return null.
- stdev(x1,x2,x3,...) - Calculate the standard deviation of the list of numbers. [1.1.0]
- median(x1,x2,x3,...) - Calculate the median value of the list of numbers. [1.1.0]
4.2.3 Prediction functions
Prediction functions take historical data and calculate a prediction using the ordinary least square method, see http://en.wikipedia.org/wiki/Ordinary_least_squares. The OLS functions can predict a value in future, ols, and the slope of the curve, olss. The functions take the following parameters:
ols(host, service, serviceitem, resolutionMethod, resolution, forecast, timeOffSet)
olss(host, service, serviceitem, resolutionMethod, resolution, timeOffSet)
The parameters have the following meaning:
- host - the host name to get from the cache
- service - the service name to get from the cache
- serviceitem - the serviceitem name to get from the cache
- resolution - the time resolution that the calculation is based on . Supported values are H (hour), D (day) and W (week)
- forecast - depending on the resolution this is the number of unities of the resolution to calculate the prediction for. If resolution is D and forecast is 10 the calculated value will be the predicted value 10 days from now.
- timeOffSet - defines the number of historical data that will be used in the prediction calculation. The unit is defined by the resolution parameter. E.g., if the timeOffSet is set to 14 and resolution is D the prediction will be based on 14 days of historical data.
- resolutionMethod - the calculation method to use if there are multiple cached data in the resolution period. Supported methods are AVG, MAX and MIN.
4.3 Null value in the cache
Null values represents non-existent data. A null value in the cache can exists due to different reasons.
- The connection specified in the service fails. By default, a null value will not be stored when this happens but if the property saveNullOnConnectionError is set to true, a null value will be inserted in the cache.
- If the execstatement specified for the serviceitem returns null, a null value is inserted in the cache.
When accessing the cache by index or by time such as, erphost-orders-ediorders[10] or erphost-orders-ediorders[-5M], it will return null:
- If null is stored in the cache at the index.
- If null is stored in the cache at the index that the time specification resolves to.
- If the index is out of bounds of the specified cache size.
When using cache data with a mathematical function that takes a list of arguments, the null value can be handled in different ways depending on how the cache data is retrieved and how the property notFullListParse is set. Let us show an example to explain the different scenarios.
sum(erphost-orders-ediorders[0], erphost-orders-phoneorders[0]) * erphost-orders-state[0]
In the above example the sum function will evaluate to null if erphost-orders-ediorders[0] and/or erphost-orders-phoneorders[0] return null. If the property notFullListParse is set, the sum function will only return null if both erphost-orders-ediorders[0] and erphost-orders-phoneorders[0] return null. The whole statement will return null independently of the notFullListParse property if erphost-orders-state[0] returns null.
By the example we can see that the property notFullListParse has effect on how null is managed for functions that manage a list of data like sum, avg, max, min, etc. What the notFullListParse property do is that it will filter out all null values when they occur in a function that takes a list of data. This works in the same way if ranges are used as the example below.
sum(erphost-orders-ediorders[0:100],erphost-orders-phoneorders[-5M:-15M]) * erphost-orders-state[0]
If the notFullListParse is set to true, all the cache data in erphost-orders-ediorders[0:100] and erphost-orders-phoneorders[-5M:-15M] will be filtered out. For functions like avg the calculated average will only be based on the none null values.
The notFullListParse property have another implication if using mathematical expressions inside a function that take a list of values. Example:
avg(erphost-orders-ediorders[0] * 2, erphost-orders-phoneorders[0] * 3)
The above example will result in null for the whole avg function if any of erphost-orders-ediorders[0] or erphost-orders-phoneorders[0] is null since the multiplication with a constant will fail if any of the cache data items is null. To manage this, the multNull [G] [G] See JEP extensions↑ for more information about functions that manage null. function must be used instead of the * operator.
avg(multNull(erphost-orders-ediorders[0],2), multNull(erphost-orders-phoneorders[0],3))
Using multNull will result in that the avg function will return null only if both erphost-orders-ediorders[0] and erphost-orders-phoneorders[0] are null.
All properties described above are global for all service definitions.
4.4 Aggregations
Aggregations of cached data can be automated by Bischeck, see Cache templates↓. The aggregation is done on intervals hour, day, week and month. Aggregation methods available are
- avg - calculate the average value of the period
- min - calculate the min value of the period
- max - calculate the max value of the period
It is also possible to configure the aggregation to include or exclude weekends, Saturdays and Sundays.
The aggregated data is stored in the cache as any other collected data and can be retrieved from the same cache in the same way as the collected data. The difference is the name convention used for aggregated data. For the service definition erphost-orders-ediorders the aggregated data will have the following format for hourly based aggregation where average calculation is used and weekend days are included:
erphost-orders/H/avg/weekend-ediorders
If weekends are not included the format will be:
erphost-orders/H/avg-ediorders
The period is defined as H (hour), D (day), W (week) and M (month). Data is stored in the same order as for collected data, the last calculated aggregation is at index 0. How many aggregated data items that will be kept in the cache is defined per service definition, see Cache templates↓.
5 Threshold configuration
A threshold value defines if the measured value for a service definition is within the boundary of the expected. To define the state of the measured service definition value, a threshold class is specified for each serviceitem. The threshold class evaluates the measured value with some logic and returns the state as OKAY, WARNING, CRITICAL or UNKNOWN. The threshold instance for the specific serviceitem is stored in a threshold cache and valid for a period of a day. Every new day the threshold cache is invalidated and Bischeck looks for new valid threshold classes to instantiate for each serviceitem. The reason that the period is set to one day is that there may be a need to configure the threshold instance differently depending on the day of the week or month.
A valid threshold class must implement the interface Threshold. This structure enables a flexible implementation of very different ways to calculate or specify a threshold. In the simplest form, a threshold class could just return an OKAY independently of measured values and in the more complex solution be based on algorithms, database content, content in the Bischeck cache, day of month or some complex combination.
Warning and critical level specifications are also part of the threshold class. The threshold class is responsible for the definition of supported operations for the measured value, e.g. that measured value should be higher, lower or in an interval of the threshold. Warning and critical levels should be defined as a percentage of the threshold.
5.1 Twenty four hour threshold
The Twenty4Hour threshold class divides the day into 24 hours. For each hour of the day a threshold is defined. The two threshold values that are next to each other are used to calculate a slope of a linear equation between the two. For example, if the threshold value is set to 1000 at 14:00 and to 1600 at 15:00, the calculation for a threshold value between 14:00 and 15:00 is y=x*(1600-1000)/60 + 1000. At 14:20 the threshold is 20*(1600-1000)/60+1000 = 1200.
The threshold model gives a linear equation with one hour granularity but over a 24 hour period it can resemble a non-linear curve. This behavior is typical in business systems where the key business values are distributed in a none-linear and none constant way over the period of a day, e.g. the number of incoming orders.
5.1.1 Period definition
Since the threshold for a serviceitem can be different depending on the month, day of month, week and day of week, the configuration supports thresholds to be described on a granularity called period. A period includes multiple months and weeks definitions as long as they share the same threshold definition. For a month, it is possible to specify a specific month and/or day of a month and for a week a specific week and/or day of a week. To find the right threshold period the class looks for threshold period specification in the following order:
- Month and day of month
- Week and day of week
- Day of month
- Day of week
- Month
- Week
- Default
Month is specified between 1-12, week 1-53, day of month 1-31 and day of week 1-7 where 1 is Sunday and 7 is Saturday. The default threshold period is used if no other matching occurs.
Since holidays are often days where the business is not operational, there is a way to describe days that should not have any threshold checks. These excluded days are checked before any other rule described above is evaluated.
5.1.2 Calculation definition
The class supports three ways of how the threshold is compared to the measured value:
">" Measured value should be higher than the threshold. If the measured value is lower than threshold*warning(%), the warning state is set and if the measured value is lower then threshold*critical(%), the critical state is set.
"<" Measured value should be lower than the threshold. If the measured value is higher than threshold*(1-warning(%)), the warning state is set and if the measured value is higher than threshold*(1-critical(%)), the critical state is set.
"=" Measured should be within the interval of the threshold. If the measured value is lower than threshold*warning(%) OR higher then threshold*(1-warning(%)), the warning state is set and if the measured value is lower than threshold*critical(%) OR higher than threshold*(1-critical(%)), the critical state is set.
For complete configuration description, see section 24thresholds.xml↓.
5.1.3 Hours and threshold definition
The measured value is compared to the threshold value that is calculated from a linear equation of the two closest threshold values. As described in the introduction of this chapter, we can set the threshold values to fixed numbers, but in a business system this is not enough. Let us look at an example. The number of orders that can be invoiced during a day is probably depending on the number of orders received. Instead of setting the threshold to a fixed number we can use an expression based threshold like “80 % of received orders”. The syntax of expression based thresholds is simple and powerful. Expressions are based on the JEP package, see chapter Mathematical expressions on cache data↑, where the parameters can be any of the measured values that exist in the Bischeck cache, see Service definition cache↑. For example, the expression "erpserver-orders-ediorders[0]*0.8" sets the threshold to 80% of the last measured value of the service definition erpserver-orders-ediorders. We could also combine multiple cached values from different sources in the same expression such as "erpserver-orders-ediorders[0] / geoserver-route-finalroute[0]” to get some sort of ratio threshold.
If we just need to check parts of a day for thresholds, set the hour to NULL and no calculation will be done for that time interval that the hour is part of. For configuration examples please see 24thresholds.xml↓.
6 Server integration
Bischeck supports integration with multiple monitoring infrastructures. Each integration is implemented as a server class. The server class is responsible for message formatting and communication with the integrated server. If the server system is not responding, the message will be dropped on the Bischeck side.
6.1 Nagios integration with NSCA, NRDP and Livestatus
The data format between Bischeck and Nagios follows the standard Nagios format for passive checks. This means that the Nagios host and service name must be the same as the configuration in Bischeck. Even for passive checks, Nagios requires that a check command is specified for the Nagios service like check_dummy or equivalent check command. Bischeck follows the Nagios specification for check command output which requires that data is split in a status and a performance part separated with the pipe sign (|).
The Bischeck status output has the following format:
<level> <serviceitem name> = <measured value> (<threshold> <warning value> <warning_calc method> <critical value>) <critical calc method> , <serviceitem name> = ...
Since a service can have multiple serviceitems, the output is presented as a concatenated string of the serviceitems. The <measured value> is the value that was retrieved from the execution of the specific service definition’s serviceitems execute statement. The <threshold> is the current threshold value that the measured value has been evaluated against. The calculated warning and critical levels are based on the percentage value of the threshold.
Depending of the calculation method, the string representation will differ. The following methods are supported:
- Measured value must be higher than the threshold: <warning level> = > W > <critical level> = > C >
- Measured value must be lower than the threshold: <warning level> = < W < <critical level> = < C <
- Measured value must be in the interval to the threshold: <warning level> = = +-W = <critical level> = = +-C =
Example of the output:
OK ediOrders = 12000 (11000 > W > 9900 > C > 7700)
In this case, the threshold value is 11000 and the warning and critical levels have been set to 10% and 30 % of the current threshold. Since both the warning and critical level are fixed percentages, the calculated levels will change with any change of the threshold.
If there are no threshold values defined for the current period in which the measured value is collected, the threshold is reported as null and no calculation is done that can be used for notification. Null can also be reported as the measured value. This can occur if a none or a null value is retrieved for the serviceitem, for example from a faulty SQL statement. Service connection problems will by default be reported as critical. This can be changed by setting the property saveNullOnConnectionError, see properties.xml↓. The service state will be based on the serviceitem with the highest level of severity if there are more than one serviceitem defined for the service. If one serviceitem reports critical and another reports OK, the service will report critical.
If no threshold is defined, the status will be reported as:
OK ediOrders = 12000 (NA)
For performance data, each serviceitem is included with the addition of the current threshold.
ediOrders=12000;9900;7000;0; threshold=11000;0;0;0; avg-exec-time=223ms
The execution time of the serviceitem execute statement is always part of the performance data and reported as avg-exec-time in milliseconds. With the pnp4nagios template that is provided with the Bischeck installation the average execution time is not graphed [H] [H] For more information how to configure pnp4nagios please visit http://docs.pnp4nagios.org/ .
All server integrations are configured in the $BISHOME/etc/servers.xml file, see server.xml ↓ for more information.
6.1.1 NSCA configuration
The configuration parameters to define in file server.xml for NSCA are:
- class - NSCAServer
- hostAddress - the IP address or name for the NSCA server, default is localhost.
- port - the socket port number on the NSCA server where NSCA is listening, default is 5667.
- connectionTimeout - the timeout time in milliseconds before Bischeck gives up on the connection, default is 5000.
- encryptionMode - the encryption mode used in the communication with the NSCA server. Supported encryption modes are NONE, XOR, and TRIPLE_DES, default is XOR.
- password - the NSCA server password, no default value.
6.1.2 NRDP configuration
The configuration parameters that to define in file server.xml for NRDP are:
- class - NRDPServer
- hostAddress - the IP address or name for the NRDP server, default is localhost.
- port - the socket port number on the NRDP server where NRDP is listening, default is 80.
- connectionTimeout - the timeout time in milliseconds before Bischeck gives up on the connection, default is 5000.
- path - the URL path for NRDP, default is nrdp.
- password - the NRDP server token, no default value.
- ssl - enable HTTPS connection to the NRDP server, default is false. [1.1.0]
The resulting URL will have the following format:
http://<hostAddress>:<port>/<path>
6.1.3 Livestatus configuration
The configuration parameters to define in file server.xml for Livestatus are:
- class - LiveStatusServer
- hostAddress - the IP address or name for the Livestatus server, default is localhost.
- port - the socket port number on the server where Livestatus is listening, default is 6557.
- connectionTimeout - the timeout time in milliseconds before Bischeck gives up on the connection, default is 5000.
6.1.4 Nagios state on null
If the service connection fails or the serviceitem execstatement returns a null value, it is not possible to calculate the threshold or to determine the state that should be propagated to Nagios. The state that should be communicated to Nagios in this type of situation is defined by property stateOnNull, that can be set to CRITICAL (2), WARNING (1), OK (0) or UNKNOWN (3). Default is UNKNOWN.
6.2 OpenTSDB
OpenTSDB is a monitoring system that provides storage and indexing for high volumes of time series data. The OpenTSDB integration is implemented over the OpenTSDB text based protocol. Bischeck send 4 lines to OpenTSDB for each service definition. The lines include measured, threshold, warning and critical values. No state information is sent.
put bischeck.measured 1288946927 12000 host=erpserver service=orders serviceitem=ediOrders
put bischeck.threshold 1288946927 11000 host=erpserver service=orders serviceitem=ediOrders
put bischeck.warning 1288946927 9900 host=erpserver service=orders serviceitem=ediOrders
put bischeck.critical 1288946927 7700 host=erpserver service=orders serviceitem=ediOrders
For more information about the OpenTSDB text protocol, please visit http://opentsdb.net
The configuration parameters to define in file server.xml for OpenTSDB are:
- class - OpenTSDBServer
- hostAddress - the IP address or name for the OpenTSDB server, default is localhost.
- port - the socket port number on the OpenTSDB server where OpenTSDB is listening, default is 4242.
- connectionTimeout - the timeout time in milliseconds before Bischeck gives up on the connection, default is 5000.
6.3 Graphite
Graphite is a monitoring system that provides excellent graphing and visualization. Access to the data in Graphite is through a graphical web console that provides an easy way to view many different data sources. The Graphite integration is provided over Graphites text based protocol using the following simple format:
metric_path value timestamp\n
The metric_path is a dot separated string like foo.bar.baz. Value is a number and timestamp is the time when the data was collected in the UNIX epoch time format in milliseconds.
As of Bischeck 4, lines are sent to Graphite for each service definition. The lines include measured, threshold, warning and critical values. No state information is sent.
erpserver.orders.ediOrders.measured 12000 1288946927\n
erpserver.orders.ediOrders.threshold 11000 1288946927\n
erpserver.orders.ediOrders.warning 9900 1288946927\n
erpserver.orders.ediOrders.critical 7700 1288946927\n
The Graphite server integration supports a method to filter data that will be sent to Graphite. The filter is defined by regular expressions with the property doNotSendRegex. If a host-service-serviceitem in matches the regular expression, it will not be sent to Graphite. Multiple regular expressions can be defined using a list of regular expressions in the property doNotSendRegex by setting a delimiter between the regular expressions defined by the property doNotSendRegexDelim. For example the regular expression ^erpserver will not send any host-service-serviceitem that begins with the string erpserver.
The configuration parameters to define in file server.xml for Graphite are:
- class - GraphiteServer
- hostAddress - the IP address or name of the Graphite server, default is localhost.
- port - the socket port number on the Graphite server where Graphite is listening, default is 2003.
- connectionTimeout - the timeout time in milliseconds before Bischeck gives up on the connection, default is 5000.
- doNotSendRegex - A list of regular expressions. Default is no regular expressions.
- doNotSendRegexDelim - The delimiter to separate regular expressions in the property doNotSendRegex, default is “%”.
6.4 Librato
[1.1.0]
Librato is a commercial cloud based monitoring service, https://metrics.librato.com. With the Librato integration metrics data can be pushed to Librato. Librato do not currently support any means to receive the Bischeck threshold calculated state.
The Librato naming is based on two fields - source and metric name. By default the Bischeck host and service name is used as the source name separated with the nameSeperator property and the serviceitem name as the metric name. If the property serviceAndItemName is set to true the source name will only be the Bischeck host name and the metric will be the service and serviceitem name separated with the nameSeperator.
If property sendThreshold is true the calculated threshold will be named as metricsname_threshold in Librato.
The configuration parameters to define in file server.xml for Librato are:
- class - MetricsLibratoServer
- apiUrl - the url to the Librato service, default https://metrics-api.librato.com/v1/metrics.
- email - the email address of the Librato registered account.
- authToken - the authToken generated for the Librato account.
- sendThreshold - send the threshold value in addition to the measured metric data, default is true.
- nameSeparator - the separator to use between names for source or metric name, default is dash, "-".
- serviceAndItemName - by default the serviceitem name is used as the Librato use the service and serviceitem as the Librato metric name, default is false.
- connectionTimeout - the timeout time in milliseconds before Bischeck gives up on the connection, default is 5000.
- doNotSendRegex - A list of regular expressions. Default is no regular expressions.
- doNotSendRegexDelim - The delimiter to separate regular expressions in the property doNotSendRegex, default is “%”.
7 Bischeck configuration files
The basic configuration files are xml based and located in the $BISHOME/etc directory. The distribution package includes all xml schema files, xsd, used for validation of the configuration files. For detailed information, please review the xsd files located in the directoryi $BISHOME/resources. Remember that all xml configuration files should use HTML encoded characters.
There are two important aspects of the Bischeck configuration to enable flexibility and a compact configuration structure - macros and templates. Macros come in two shapes, configuration macros and runtime macros. Configuration macros are set at startup time and are fixed during runtime. Runtime macros are evaluated in runtime and dynamic to their nature.
Templates are used in configuration files to support re-usability of common configuration blocks which works very well to minimize the amount of configuration code.
7.1 Naming standard
The naming of hosts, services and serviceitems must adhere to the following rules: host names can include any character from a-z, A-Z and 0-9. The host name may also include the characters, dash (-), dot (.) and underscore (_), although it is not allowed to start the name with any of the these characters. Examples of valid names are erphost.xyz.com and erp1_host.my-domain.com.
- service and serviceitem can include any character from a-z, A-Z and 0-9. The name can also include the characters, dash (-), dot (.), underscore (_), at sign (@) and space ( ). It is not allowed to start or end the name with dash (-) and space ( ).
-
Dash (-) is the separator character between host, service and serviceitem name when used in expressions. When using a host-service-serviceitem[X] expression in the execstatement tag of a serviceitem in the bischeck.xml configuration file, or in an the hour tag and the hourinterval’s threshold tag of a hours section in the 24thrsholds.xml , a dash (-) in any of the names must be quoted with a backslash (\), like:If macros are used, see Configuration macros↓, and they are replaced with host, service and serviceitem names that include dash (-) they will automatically be quoted by Bischeck.
avg(erp1_host.my\-domain.com-service-item[0:9])
7.2 Configuration macros
Configuration macros have the format of $$macroname$$. The following configuration macros are supported:
- $$HOSTNAME$$ - will be replaced with the value of tag <name> in the current scope from the host section
- $$HOSTALIAS$$ - will be replaced with the value of tag <alias> in the current scope from the host section
- $$SERVICENAME$$ - will be replaced with the value of tag <name> in the current scope from the service section
- $$SERVICEALIAS$$ - will be replaced with the value of tag <alias> in the current scope from the service section
- $$SERVICEITEMNAME$$ - will be replaced with the value of tag <name> in the current scope from the serviceitem section
- $$SERVICEITEMALIAS$$ - will be replaced with the value of tag <alias> in the current scope from the serviceitem section
All the *NAME macros are supported both in the bischeck.xml and 24thresholds.xml file. The *ALIAS macros are only supported in the bischeck.xml since there is no equivalent alias tag in 24thresholds.xml.
7.3 Runtime macros
Runtime macros are evaluated in runtime and have the format %%macro%%. Currently, only data macros are supported.
7.3.1 Date formatting macro
Many serviceitems will typically execute something depending on a date. For this reason, Bischeck supports date macros in the execute statement of serviceitems. For example, in the following SQL select statement that is using a date condition, the formatting could be done like this:
select count(orders) from order where
fromdate=’%%yyyy-MM-dd%%’ and
todate=’%%yy.MM.dd%[D2]%%’
Bischeck will replace anything between %% and %% with the current date according to the format string. The formatting follows the structure of the Java SimpleDateFormatter class. If the format string includes a %[] macro, the current date will be calculated, where Y means year, M means month and D means day. %[D-1] will subtract one day from the current date and %[M2] will add two months to the current date. A construction like D-1Y-1 is not supported.
7.4 bischeck.xml
The Bischeck configuration can be described as a hierarchy of hosts, services and serviceitems to monitor. Each host can have one or more services, and for each service one or more serviceitems can be configured. Below is an example of a simple configuration without templates.
1<bischeck> 2 <host> 3 <name>erpserver</name> 4 <alias>172.25.1.113<alias> 5 <desc>ERP server</desc> 6 <service> 7 <name>orders</name> 8 <desc>Order management</desc> 9 <schedule>0 0/5 * * * ?</schedule> 10 <url> 11 jdbc:mysql://$$HOSTALIAS$$/erpdb?user=bischeck&password=bischeck 12 </url> 13 <driver>com.mysql.jdbc.Driver</driver> 14 <serviceitem> 15 <name>ediorders</name> 16 <desc>Inbound edi orders</desc> 17 <execstatement> 18 select count(*) from orders where createdate='%%yyyy-MM-dd%%' 19 </execstatement> 20 <thresholdclass>Twenty4HourThreshold</thresholdclass> 21 <serviceitemclass>SQLServiceItem</serviceitemclass> 22 </serviceitem> 23 </service> 24 </host> 25</bischeck>
In the host section the following elements are defined:
- name - (mandatory) the name of the host [I] [I] Must be the same name as the host name configured on the Nagios server..
- inactive - (optional, default false) if set to true, the host and all its services will not be configured.
- alias - (optional) can be anything
- desc - (optional)description field
In the service section the following elements are defined:
- name - (mandatory) the name of the service [J] [J] Must be the same name as the service name configured on the Nagios server..
- inactive - (optional, default false) if set to true the service and all its serviceitems will not be configured.
- alias - (optional) can be anything
- desc - (optional) description field
- schedule - (one is mandatory) one to many service execution schedules can be defined. See the section Service scheduling ↓ for more information about scheduling options.
- sendserver - (optional, default true) true or false to define if the service data should be sent to the configured monitoring servers, see server.xml ↓. If set to false the measured data will only be placed in the Bischeck cache and be used to create virtual services and threshold rules.
- url - (mandatory) the connection specification for the server/service to monitor in an url format
- driver - (optional) a class that may be needed by the url specification. The driver class should be placed in the $BISHOME/customlib directory.
In the serviceitem section, the following elements are defined:
- name - (mandatory) name of the serviceitem
- alias - (optional) can be anything
- desc - (optional) description field
- execstatement - (mandatory) the specification of what to be executed by the serviceitem. The statement will be dependent on the type of serviceitem class used.
- serviceitemclass - (mandatory) the ServiceItem class to use for the serviceitem. For ServiceItem classes that are part of the distribution the class name is enough. For custom developed ServiceItem classes the full class name should be specified and the classes or jar files should be located in the customlib directory.
- thresholdclass - (optional) the Threshold class to be used by the serviceitem configuration. For Threshold classes part of the distribution, the class name is enough. For custom developed Threshold classes, the full class name should be specified and the classes or jar files should be located in the customlib directory.
Note that the order of the attributes is fixed and defined by the schema file.
7.4.1 Service and serviceitem templates
Instead of specifying a service for each host, a service template can be used. In the example below, two hosts using the same service template called ordertemplate are configured.
1... 2 <host> 3 <name>erpserver1</name> 4 <alias>172.25.1.113<alias> 5 <desc>ERP server branch FOO</desc> 6 <service> 7 <template>ordertemplate</template> 8 </service> 9 </host> 10 11 <host> 12 <name>erpserver2</name> 13 <alias>172.25.1.123<alias> 14 <desc>ERP server branch BAR</desc> 15 <service> 16 <template>ordertemplate</template> 17 </service> 18 </host> 19 20 <servicetemplate templatename="ordertemplate"> 21 <name>orders</name> 22 <desc>Order management</desc> 23 <schedule>0 0/5 * * * ?</schedule> 24 <url> 25 jdbc:mysql://$$HOSTALIAS$$/erpdb?user=bischeck&password=bischeck 26 </url> 27 <driver>com.mysql.jdbc.Driver</driver> 28 <serviceitem> 29 <name>ediorders</name> 30 <desc>Inbound edi orders</desc> 31 <execstatement> 32 select count(*) from orders where createdate='%%yyyy-MM-dd%%' 33 </execstatement> 34 <thresholdclass>Twenty4HourThreshold</thresholdclass> 35 <serviceitemclass>SQLServiceItem</serviceitemclass> 36 </serviceitem> 37 </servicetemplate> 38 39....
In the above example the serviceitem was part of the service template but the serviceitem can also be defined as a template.
1... 2 <host> 3 <name>erpserver1</name> 4 <alias>172.25.1.113<alias> 5 <desc>ERP server branch FOO</desc> 6 <service> 7 <template>ordertemplate</template> 8 </service> 9 </host> 10 11 <host> 12 <name>erpserver2</name> 13 <alias>172.25.1.123<alias> 14 <desc>ERP server branch BAR</desc> 15 <service> 16 <template>ordertemplate</template> 17 </service> 18 </host> 19 20 <servicetemplate templatename="ordertemplate"> 21 <name>orders</name> 22 <alias>tbl_order</alias> 23 <desc>Order management</desc> 24 <schedule>0 0/5 * * * ?</schedule> 25 <url> 26 jdbc:mysql://$$HOSTALIAS$$/erpdb?user=bischeck&password=bischeck 27 </url> 28 <driver>com.mysql.jdbc.Driver</driver> 29 <serviceitem> 30 <template>orderSQLtemplate</template> 31 </serviceitem> 32 </servicetemplate> 33 34 <serviceitemtemplate templatename="orderSQLtemplate"> 35 <name>ediorders</name> 36 <desc>Inbound edi orders</desc> 37 <execstatement> 38 select count(*) from $$SERVICEALIAS$$ where createdate='%%yyyy-MM-dd%%' 39 </execstatement> 40 <thresholdclass>Twenty4HourThreshold</thresholdclass> 41 <serviceitemclass>SQLServiceItem</serviceitemclass> 42 </serviceitemtemplate> 43 44 45....
Using this structure, a serviceitem template can be shared between multiple services and service templates. In addition it makes it possible to change the settings in a template by using the service and serviceitem overrides.
1... 2 <host> 3 <name>erpserver1</name> 4 <alias>172.25.1.113<alias> 5 <desc>ERP server branch FOO</desc> 6 <service> 7 <template>ordertemplate</template> 8 <serviceoverride> 9 <name>ordersInERP1</name> 10 <alias>10.10.10.10</alias> 11 <schedule>15M</schedule> 12 </serviceoverride> 13 </service> 14 </host> 15 16 <host> 17 <name>erpserver2</name> 18 <alias>172.25.1.123<alias> 19 <desc>ERP server branch BAR</desc> 20 <service> 21 <template>ordertemplate</template> 22 </service> 23 </host> 24 25 <servicetemplate templatename="ordertemplate"> 26 <name>orders</name> 27 <alias>tbl_order</alias> 28 <desc>Order management</desc> 29 <schedule>0 0/5 * * * ?</schedule> 30 <url> 31 jdbc:mysql://$$HOSTALIAS$$/erpdb?user=bischeck&password=bischeck 32 </url> 33 <driver>com.mysql.jdbc.Driver</driver> 34 <serviceitem> 35 <template>orderSQLtemplate</template> 36 <serviceitemoverride> 37 <name>SSHport</name> 38 </serviceitemoverride> 39 </serviceitem> 40 </servicetemplate> 41 42 <serviceitemtemplate templatename="orderSQLtemplate"> 43 <name>ediorders</name> 44 <desc>Inbound edi orders</desc> 45 <execstatement> 46 select count(*) from $$SERVICEALIAS$$ where createdate='%%yyyy-MM-dd%%' 47 </execstatement> 48 <thresholdclass>Twenty4HourThreshold</thresholdclass> 49 <serviceitemclass>SQLServiceItem</serviceitemclass> 50 </serviceitemtemplate> 51 52 53....
Service overrides are supported for all tags in a service except for the reference to the serviceitem. Serviceitem overrides are supported for all tags in the serviceitem.
Overrides are powerful but should be used with caution.
7.4.2 Cache templates
The cache template defines how many items that should be stored in the cache for the specific service definition and what type of automated aggregation to conduct. Using a cache template is not mandatory but there is no default aggregation in the case of not using one.
1... 2 <servicetemplate templatename="ordertemplate"> 3 <name>orders</name> 4 <alias>tbl_order</alias> 5 <desc>Order management</desc> 6 <schedule>0 0/5 * * * ?</schedule> 7 <url> 8 jdbc:mysql://$$HOSTALIAS$$/erpdb?user=bischeck&password=bischeck 9 </url> 10 <driver>com.mysql.jdbc.Driver</driver> 11 <serviceitem> 12 <template>orderSQLtemplate</template> 13 <serviceitemoverride> 14 <name>SSHport</name> 15 </serviceitemoverride> 16 </serviceitem> 17 </servicetemplate> 18 19 <serviceitemtemplate templatename="orderSQLtemplate"> 20 <name>ediorders</name> 21 <desc>Inbound edi orders</desc> 22 <execstatement> 23 select count(*) from $$SERVICEALIAS$$ where createdate='%%yyyy-MM-dd%%' 24 </execstatement> 25 <thresholdclass>Twenty4HourThreshold</thresholdclass> 26 <serviceitemclass>SQLServiceItem</serviceitemclass> 27 <cache> 28 <template>cacheDef</template> 29 </cache> 30 </serviceitemtemplate> 31 32 <cachetemplate templatename="cacheDef"> 33 <aggregate> 34 <method>avg</method> 35 <useweekend>true</useweekend> 36 <retention> 37 <period>H</period> 38 <offset>168</offset> 39 </retention> 40 <retention> 41 <period>D</period> 42 <offset>60</offset> 43 </retention> 44 <retention> 45 <period>W</period> 46 <offset>53</offset> 47 </retention> 48 </aggregate> 49 50 <purge> 51 <maxcount>1000</maxcount> 52 </purge> 53 </cachetemplate> 54....
The cache template is supported for a normal serviceitem and in a serviceitem template. In the above example, a cache template is added in the serviceitem template, in lines 27-29.
In Line 33, the usage of an average based aggregation is configured. The example defines that weekend data should be included in the aggregation. In line 36, we define that hourly aggregation should be kept for 168 hours. This means that we will have a maximum of 168 items in the cache for the aggregated hourly data. See more about the aggregated service definition naming in section Aggregations↑. The same rules apply for the other periods like day, week and month.
The purge section in line 50 defines how many items that should be kept in the cache for a service definition that uses the cache template. If not configured, the property lastStatusCacheSize will be used.
7.5 properties.xml
The properties.xml sets properties used by the core of Bischeck. The properties.xml has a simple structure of key/value pair:
1<properties>
2	<property>
3		<key>akey</key>
4		<value>avalue</value>
5	</property>
6</properties>
The properties.xml file include standard Bischeck properties but can also include class specific properties used in custom developed service, serviceitem and threshold classes. A class specific property should have a key formatted in the following way - classname.propertyname. Any class specific properties must have a default value implemented by the class itself. E.g. for the JDBCService, there is a property called querytimeout that sets the max time in seconds before aborting the query. This property has the name JDBCService.querytimeout and have a default value of 10 seconds.
The following general properties are currently used by Bischeck core:
- thresholdCacheClear- the time when the threshold cache should be evicted each day, default is "10 0 00 * * ? *". Do not change this property if you are not absolutely sure what you are doing.
- pidfile - the pid file holding the process id for the Bischeck process, default is "/var/tmp/bischeck.pid".
- mindaysinfirstweek - define the week numbering according to ISO 8601, default is 4.
- firstdayofweek - define the week numbering according to ISO 8601, default is 2.
- lastStatusCacheDumpDir - the directory where the cache is stored, default is /var/tmp. Deprecated - not applicable with the redis cache.
- lastStatusCacheSize - the default maximum size of cached data per service definition, default is 500. This value is overridden by cache settings, see Cache templates↑
- runAfterDelay - the delay time in seconds used when a service is scheduled to run with “Service relation scheduling”, see Service scheduling ↓. Default is 10 seconds.
- notFullListParse - if set to true, a reference to a cache item where a list is used, like erpserver-orders-ediorders[1:10], will return data even if not all indexes in the list contains data. Read more about how this property affect the retrieval of cache data in section Null value in the cache↑.
- stateOnNull - the state to be used if an execstatment in a serviceitem returns null. The property can be set to an integer 0,1,2 or 3 or to the string OK, WARNING, CRITICAL or UNKNOWN. The default is UNKNOWN.
- saveNullOnConnectionError - this property defines if a null value should be stored in the cache if the service class has a connection exception of any sort. The default is false.
- disableCertificateValidation - this property disable SSL (X.509) certification validation for connection over HTTPS, like NRDP. Default is false. [1.1.0]
- NagiosUtil.extendedformat - defines if the Nagios performance data should include the warning and critical levels as its own data entity so it can be stored in the RRD database on the Nagios server. The extended format will look like the following example:
response=0.000192;0.000167;0.000158;0; threshold=0.000176;0;0;0;
warning=0.000167;0;0;0; critical=0.000158;0;0;0; avg-exec-time=13ms
7.5.1 Redis cache properties
The following properties control the connection to Redis:
- cache.provider.redis.server - the hostname/IP of the redis server, default is localhost.
- cache.provider.redis.port - the socket port where redis server listens, default is 6379.
- cache.provider.redis.db - the redis database number to use, default is 0.
- cache.provider.redis.auth - the authorization token for redis, default is the empty string.
- cache.provider.redis.timeout - the connection timeout, default is 2000 ms.
- cache.provider.redis.poolsize - the size of the redis connection pool, default is 50.
7.6 urlservice.xml
The configuration defines the mapping between the service url schema and the Service class. The urlservice xml has a structure of:
1<urlservices>
2	<urlproperty>
3		<key>jdbc</key>
4		<value>JDBCService</value>
5	</urlproperty>
6	<urlproperty>
7		<key>bischeck</key>
8		<value>LastCacheService</value>
9	</urlproperty>
10</urlservices>
- key – the schema part of the service url, e.g. jdbc.
- value – the Service class name. For Service classes part of the distribution, the class name is enough. For custom developed Service classes, the full class name should be specified and the classes or jar files should be located in the $BISHOME/customlib directory.
For valid url’s see Service definition - hosts, services and serviceitems↑.
7.7 24thresholds.xml
The threshold class Twenty4HourThreshold described in section Twenty four hour threshold ↑ is configured through the 24thresholds.xml file.
1<twenty4threshold> 2 <servicedef> 3 <hostname>erpserver</hostname> 4 <servicename>shipments</servicename> 5 <serviceitemname>outboundshipment</serviceitemname> 6 7 <period> 8 <!-- valid for any 21th day in the month --> 9 <months> 10 <dayofmonth>21</dayofmonth> 11 </months> 12 <!-- valid for week 12 (middle of March) 13 and if its a Thursday --> 14 <weeks> 15 <week>12</week> 16 <dayofweek>5</dayofweek> 17 </weeks> 18 19 <calcmethod>></calcmethod> 20 <warning>10</warning> 21 <critical>30</critical> 22 <hoursIDREF>1</hoursIDREF> 23 </period> 24 25 <period> 26 <!-- valid if its a Friday --> 27 <weeks> 28 <dayofweek>6</dayofweek> 29 </weeks> 30 <calcmethod>></calcmethod> 31 <warning>10</warning> 32 <critical>30</critical> 33 <hoursIDREF>2</hoursIDREF> 34 </period> 35 36 <period> 37 <!-- This will be used if no 38 other rule if applicable --> 39 <calcmethod>></calcmethod> 40 <warning>10</warning> 41 <critical>30</critical> 42 <hoursIDREF>31</hoursIDREF> 43 </period> 44 45 </servicedef> 46 47 <hours hoursID="1"> 48 <!-- 00:00 --> 49 <hour>500</hour> 50 <!-- 01:00 --> 51 <hour>1500</hour> 52 <!-- 02:00 --> 53 <hour>4000</hour> 54 ................. 55 <!-- 21:00 --> 56 <hour>9000</hour> 57 <!-- 22:00 --> 58 <hour>10000</hour> 59 <!-- 23:00 --> 60 <hour>11000</hour> 61 </hours> 62 63 <hours hoursID="2"> 64 <!-- 00:00 --> 65 <hour>1500</hour> 66 <!-- 01:00 --> 67 <hour>2500</hour> 68 <!-- 02:00 --> 69 <hour>5000</hour> 70 ................. 71 <!-- 21:00 --> 72 <hour>10000</hour> 73 <!-- 22:00 --> 74 <hour>12000</hour> 75 <!-- 23:00 --> 76 <hour>14000</hour> 77 </hours> 78 79 <hours hoursID="2"> 80 81 <hourinterval> 82 <from>09:00</from> 83 <to>12:00</to> 84 <threshold>erpserver-orders-ediorders[0]*0.8</threshold> 85 </hourinterval> 86 87 <hourinterval> 88 <from>12:00</from> 89 <to>15:00</to> 90 <threshold>erpserver-orders-ediorders[0]*0.4</threshold> 91 </hourinterval> 92 93 <hourinterval> 94 <from>16:00</from> 95 <to>17:00</to> 96 <threshold>erpserver-orders-ediorders[0]*0.2</threshold> 97 </hourinterval> 98 99 <hourinterval> 100 <from>20:00</from> 101 <to>22:00</to> 102 <threshold>10000</threshold> 103 </hourinterval> 104 105 106 </hours> 107 108 <!-- Holidays --> 109 <holiday year="2011"> 110 <dayofyear>0101</dayofyear> 111 ................. 112 <dayofyear>1224</dayofyear> 113 <dayofyear>1225</dayofyear> 114 </holiday> 115 116</twenty4threshold>
The configuration is based on two main parts, a service definition called servicedef tag and an hours tag. For each combination of host, service and serviceitem, a servicedef tag is specified. Each servicedef can have one to many period specifications, see Period definition↑. The period specifies the hoursID that should be used for a specific combination of months and weeks definitions, see Hours and threshold definition↑ for more information. The period also defines calculation method, warning and critical levels, see Calculation definition↑.
The hours tag supports two different formats, the 24 hour listing or a from-to listing. If the hours tag uses the 24 hour listing, there must be 24 hour tags, each tag representing one hour of the day. An hour tag can have a null value, meaning no threshold, a fixed value or a mathematical expression according to JEP and may use variables from any measured value existing in the service definition cache, see Service definition cache↑. For more information about threshold specifications please see Threshold configuration↑.
If the from-to format is used, there can be one to many hourintervals that define the threshold that should be used between the from-time to the to-time. Only full hours are currently supported. The following rules are valid for this format:
- If there are overlapping hours existing in the last hourinterval tag, the last definition have precedence. In the above listing that means that the threshold for 12:00 are “erpserver-orders-ediorders[0]*0.4”
- Any hour that is not defined is treated as no threshold exist for the time period. In the above example, there are no thresholds for 00:00-09:00, 17:00-20:00 and 22:00-00:00.
The final section, holidays, define days of the year where no threshold will be evaluated. A service will always return an OKAY state for these days.
7.7.1 Warning and critical override
[1.1.0]
If different levels of warning and critical is required depending of the time of the day it’s possible to override the warning and critical level set in the period. This is only support for hors sections using the hourinterval configuration.
Between 00 - 11:59 the warning and critical values in the period section will be used and between 12 and 23:59 the warning and critical "override" values are used. For the threshold between 11 and 12 the linear equation will be used to calculate the threshold value starting at 1000 at 11:00 and 2000 at 12:00, but the warning and critical will in that time interval be the values from the period section.
7.7.2 Templates
If there are many service definitions that will use the same threshold definition, they can be grouped in a servicedefgroup. The servicedefgroup can have multiple members, where each member defines a service definition, and one period template that they all share.
1..... 2 <servicedefgroup> 3 <member> 4 <hostname>erpserver1</hostname> 5 <servicename>shipments</servicename> 6 <serviceitemname>outboundshipment</serviceitemname> 7 </member> 8 <member> 9 <hostname>erpserver2</hostname> 10 <servicename>shipments</servicename> 11 <serviceitemname>outboundshipment</serviceitemname> 12 </member> 13 14 <template>outboundShipments</template> 15 </servicedefgroup> 16 17 <servicedeftemplate templatename="outboundShipments"> 18 19 <period> 20 <!-- valid if its a Friday --> 21 <weeks> 22 <dayofweek>6</dayofweek> 23 </weeks> 24 <calcmethod>></calcmethod> 25 <warning>10</warning> 26 <critical>30</critical> 27 <hoursIDREF>2</hoursIDREF> 28 </period> 29 30 <period> 31 <!-- This will be used if no 32 other rule if applicable --> 33 <calcmethod>></calcmethod> 34 <warning>10</warning> 35 <critical>30</critical> 36 <hoursIDREF>31</hoursIDREF> 37 </period> 38 39 </servicedeftemplate> 40 41.... 42
In the above example, both erpserver1-shipments-outboundshipment and erpserver1- shipments-outboundshipment share the same threshold template named “outboundShipments”. The servicedefgroup and servicedeftemplate must be located before any individual servicedef definitions.
7.8 server.xml
The configuration file defines the servers that Bischeck should be integrated with. The server.xml has the following structure:
1<servers> 2 <server name="Nagios1"> 3 <class>NSCAServer</class> 4 <property> 5 <key>hostAddress</key> 6 <value>localhost</value> 7 </property> 8 <property> 9 <key>encryptionMode</key> 10 <value>XOR</value> 11 </property> 12 <property> 13 <key>password</key> 14 <value>change this</value> 15 </property> 16 <property> 17 <key>port</key> 18 <value>5667</value> 19 </property> 20 <property> 21 <key>connectionTimeout</key> 22 <value>5000</value> 23 </property> 24 </server> 25 26 <server name="Nagios2"> 27 <class>NSCAServer</class> 28 ...... 29 </server> 30 31</servers>
Each server that is integrated with Bischeck must be defined with the server tag and with a unique attribute name. This solution enables Bischeck to send data to multiple servers of the same type, such as multiple NSCA servers. The class tag defines the Server class implementation to use for the integration. Each Server implementation can have a different number of properties that is specific for the Server class. Custom developed server classes should be placed in the customlib directory.
7.8.1 Circuit breaks
Circuit breaks is a technique to detect if the remote server is down or unable to accept connections. If the remote server is not responding correctly after a number of configured attempts, the circuit break will “OPEN” and Bischeck will stop sending data during a timeout period before retrying. The implementation is inspired by Michael Nygard’s circuit break pattern in the excellent book "Release It!".
Server classes that support the circuit break have 3 additional properties:
- cbEnable - enable circuit break, default is false.
- cbAttempts - the number of connection attempts before the circuit break is set in an OPEN state, default 5.
- cbTimeout - the time in milliseconds that the circuit break will stay in the OPEN state before going to HALF-OPEN and retry the connection, default is 60000.
Currently, the following server classes support circuit breaks:
- NSCA
- NRDP
The state of a circuit break can be instrumented through JMX.
8 Service scheduling
The service scheduling defines when a service is triggered to be executed. For each service there can be multiple scheduling configurations, but at least one is mandatory. The scheduling can be configured in three ways.
8.1 Interval scheduling
The format describes an interval repeated forever. The format is just a number and an indicator defining the granularity in seconds (S), minutes (M) or hours (H). 10M specify that the service should be executed every ten minutes.
1<schedule>10M</schedule>
The initial start time for an interval based schedule is calculated as a time randomly in the specified interval. For 10M this means that the service’ first schedule is between 0 to 10 minutes from the start time of Bischeck or at a reload.
8.2 Cron based scheduling
The second format is more advanced and follows the cron specification of Quartz, see http://www.quartz-scheduler.org. Using this format, it is possible to define scheduling expressions like “0 15 10 ? * MON-FRI” which would schedule the service at 10:15am every Monday to Friday. For more cron examples, please visit http://www.quartz-scheduler.org/documentation/quartz-2.1.x/tutorials/crontrigger
1<schedule>0 15 10 ? * MON-FRI</schedule>
8.3 Service relation scheduling
The service relation scheduling triggers a service to execute after another service has been scheduled. This is useful when a service is depending on data from another service for its thresholds or execution statement. The format is “host-service” specifying the host and service that will trigger the execution of the service.
1<schedule>erpserver-orders</schedule>
9 Configuration tools
Bischeck provides by default no additional tools for configuration other than the normal editor to manage the xml configuration files.
A web based configuration tool, Bisconf, is under development. Bisconf is hosted on the Bischeck project site, http://www.bischeck.org. Check release notes to see what version of Bischeck that is supported by Bisconf.
10 Bischeck license
Bischeck is licensed under GNU license version 2. For more info please visit http://www.gnu.org/licenses/gpl-2.0.html
11 Bug reports and feature requests
Please submit bug reports and feature requests on www.bischeck.org in the Forge section.
12 Credits
Thanks to all people and organizations who developed all the great open source software that Bischeck depends on. The Bischeck project would like to thank the following companies for sponsoring the project with valuable commercial tools and development environments:
- Contemplate supports the Bischeck projects with the ThreadSafe tool for advanced static analysis for Java concurrency, http://www.contemplateltd.com/threadsafe
- YourKit is kindly supporting Bischeck open source projects with its full-featured Java Profiler, http://www.yourkit.com/java/profiler
- Cloudbees provides continuous integration services through Jenkins, http://www.cloudbees.com/
- Librato to provide test environment, https://metrics.librato.com/