bischeck
-
A Business Activity Monitoring Server
Version 0.4.1
2012-10-01
Table of Contents
1 Introduction
Monitoring and surveillance is today common in any IT operation. The market is mature and a number of excellent solutions exists, especially in the open source market, like Nagios. But when it comes to monitoring of business applications the maturity is not on the same level. Business operations teams seldom has any monitoring solution to understand what goes on in their business processes and applications. Business intelligence solutions can often tell what happened last month, but from a more tactical operations view there is a gap. So why do not business operations team implement the same surveillance structure or use the existing IT operations infrastructure to understand “why number of orders have dropped under the current threshold”?
So what is the difference between business activity monitoring, BAM, and traditional IT infrastructure monitoring? Basically its the same, some entity to measure and for that entity define thresholds levels that will generate warning or critical alarms. The demands we have seen in addition to the basic functionality are the following features provided by bischeck:
- Support for dynamic and adaptive thresholds.
- Support dynamic configuration of thresholds depending of time of the day and day of month or week.
- Support threshold based on fixed values and thresholds based on the measured value from other services. This it typical in process driven businesses.
- Support for a large number of mathematical functions used to calculate thresholds.
- Data cache for all measured service items that can be retrieved based on index or time. Cache data is the main source to create dynamic and adaptive thresholds.
- Support multiple scheduling schema per service. This enable a fine grain control of when a service should be run. bischeck support interval scheduling, cron scheduling and service relation based scheduling.
- Configure services that are based on multiple measured values of other services, what could be described as "virtual" entities.
- Support date macros in the execution statements of a service, typical used in a where clause when selecting from databases.
- Support a multitude of ways to connected to the source system by allowing custom developed service connection methods.
- Support for custom threshold classes to enable any way to define threshold logic.
- Integrates with multiple monitoring and surveillance tools, like any Nagios like systems that supports the Nagios Service Check Acceptor (NSCA) and/or the Nagios Remote Data Processor (NRDP) [Beta in 0.4.1] protocol [A→] [→A] Nagios Core, Nagios XI, Icinga, OP5 Monitor, Shinken, Opsview, Centreon, NetEye, etc. , OpenTSDB and more. [New in 0.4.0]
Lets look at 3 examples that would be solved by using bischeck:
Example 1 – Monitor the number of orders received during the day
Example 1 – Monitor the number of orders received during the day
The order management application receive orders 24 hours a day during Monday to Friday. The total aggregated number of orders are different depending on time of the day. The business expect to have a total numbers of orders of 1500 at 13:00, at 14:00 the order count should be 2300, at 15:00 it should be 3400, etc. Between every hour the business want to interpolate that the order rate are according to a linear equation between the defined hour rates. This means that the threshold at 13:20 is (2300-1500)*20/60+1500 = 1767. The warning alarm level should be between 90% and 70% of the threshold and critical alarm if the measured value is below 70% of the threshold.
Example 2 – Monitor the number of created invoices in relation to the number of received orders
Example 2 – Monitor the number of created invoices in relation to the number of received orders
The invoice system should invoice at lest 80% of the daily incoming orders in the same day with one hour delay. This means that the measured value of orders with one hour delay must be used as a threshold for the number of created invoices.
Example 3 – Monitor the current number of orders and if the inflow is zero we need an alarm
Example 3 – Monitor the current number of orders and if the inflow is zero we need an alarm
The order system have a table with all received orders, but the requirement is that we need to monitor how many that has been received during the last 10 minutes. If this value is zero an alarm must be generated since its an indication that the sales system are not generating orders. To achieve this monitoring we use the last and the previous sample of the total number of orders from example 1 and create the difference between the two to get a new virtual entity to measure, with an threshold level of 0.
Hopefully these examples have convinced you that with bischeck you can do complex application monitoring by advanced threshold management and processes dependencies. And this can be done by just integrate it with your existing IT surveillance infrastructure.
Hopefully these examples have convinced you that with bischeck you can do complex application monitoring by advanced threshold management and processes dependencies. And this can be done by just integrate it with your existing IT surveillance infrastructure.
But complex threshold management is not limited to the area of BAM. Even in the normal infrastructure and network monitoring the capabilities are important. A typical threshold for disk utilization is defined like 90% of total space. This is of course important but it could be equally important to understand the growth speed of the disk utilization, like if the size has grown with 5% from yesterday. This is simple in bischeck without develop a specialized check command.
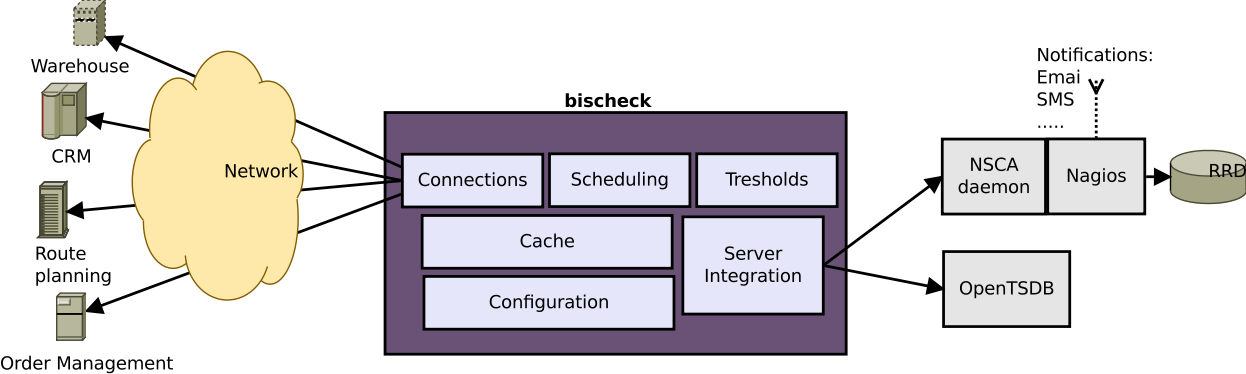
- Configuration - Manage all configuration of bischeck
- Scheduling - Controls the execution time of each service
- Connection - Manage connection management against the source systems to monitor
- Threshold - Manage the threshold configuration and processing
- Cache - Storage of all values that has been collected from the source systems
- Server integration - Manage integration and formatting to the different monitoring systems
bischeck is open source and licensed under GPL version 2. bischeck is written in Java and runs as a stand-alone daemon and integrates with different monitoring and surveillance tools over open protocols. If you have ideas to new features, find bugs, etc please visit http://www.bischeck.org where you can fill in bug reports and feature requests. You can also email anders.haal@ingby.com. We look forward to your feedback.
2 Service configuration
The design of bischeck is based on the concept of configuring hosts, services and service items. As an example we have host erpserver and we define a service called orders. For the order service we can have multiple service items, defined like ediOrders and mailOrders. The service define a connection url to connect to the entity to measure and the service items define the statement to be executed to retrieve the entity value. The service url is used by bischeck to instantiate the right service class to manage the the connection. For example if the url has a schema part that is jdbc, the JDBCService class is used. The mapping between the service url and the class to use is configurable. Each service class must implement the Service interface. The execution statement described for the service item must only return one single value. A service item class must implement the interface Serviceitem. The host can av multiple service, and each service can have multiple service items.
All host, service and service items are described in xml configuration files located in the etc directory of the installation, $BISHOME. For more information about services and service items classes please section3↓.
All host, service and service items are described in xml configuration files located in the etc directory of the installation, $BISHOME. For more information about services and service items classes please section3↓.
3 Services and service items classes
The key configuration objects in bischeck are the service and service item. The service key attributes are the service name, the schedules when to execute the service and the url that define the connection used by the service item.
The service item key attributes are the execute statement that define what should be executed to retrieve the measured entity and the threshold class used to process the measured entity to validate the state of the measured entity.
3.1 Service classes
The following Service classes is provided in the standard bischeck distribution.
3.1.1 JDBC
JDBCService manage services connecting to databases over JDBC. JDBC driver jars should be put in the directory customlib in the bischeck install directory to automatically be found at start-up.
A JDBC connection is described with a normal jdbc url and with an additional driver class in the driver tag of the bischeck configuration.
3.1.2 Livestatus
LivestatusService enable connectivity to any Nagios server supporting MK Livestatus [B→]
[→B] More information on MK Livestatus can be found on http://mathias-kettner.de/checkmk_livestatus.html
. With this service both the service state and performance data can be retrieved from a Nagios server.
[New in 0.4.0]
. A livestatus connection is specified with a url with the following format:
livestatus://hostname:port
The requirement for this type of connection is that livestatus is configured as a xinetd service on the server running livestatus and Nagios. To configure livestatus this way please see “Remote access to Livestatus via SSH or xinetd”.
3.1.3 Bischeck cache
LastCacheService enables connection to bischeck’s internal cache where the measured data is stored. With the service any existing host->service->serviceitem can be retrieved from the cache. This can typical be used to create new virtual services based on mathematical expression for combination of cache entities. The connection url for the bischeck cache is:
bischeck://cache
3.1.4 Shell (beta)
[New in 0.4.1]
ShellService enables execution of programs and scripts on the localhost. The connection url for the shell service is:
shell://localhost
3.2 Service item classes
The following ServiceItem classes is provided in the standard bischeck distribution.
3.2.1 SQL
The SQLServiceItem class enables execution of a SQL statements. Its important that the SQL statement only return one single number value, like a "select count(*) ...." or “select sum(orderValue) from ....”.
The SQLServiceItem class can be used when the service url is a jdbc://... url.
3.2.2 Livestatus
With the LivestatusServiceItem class both state and performance data can be queried for a Nagios service. The query is formatted as a json structure. To query a specific Nagios service state the following statement example can be used:
{"host":"linux-server1","service":"DNS","query":"state"}
The above will query the current Nagios state of service DNS for host linux-server1.
To query the the performance data for the Nagios service HTTP just change the query key value to perfdata and add the label key so the right label in a multi value performance data is retrieved:
{"host":"linux-server1","service":"HTTP","query":"perfdata","label":"size"}
The LivestatusServiceItem class can be used for service url livestatus://hostname:port.
3.2.3 Cache calculations
CalculateOnCache service item class enable statement execution using measured values residing in the bischeck internal cache. Mathematical statements according to jep expressions capability is possible like:
if((erpserver-orders-ediOrders[0] - erpserver-orders-ediOrders[1]) < 0,0, erpserver-orders-ediOrders[0] - erpserver-orders-ediOrders[1])
The above example check if the result of "erpserver-orders-ediOrders[0] - erpserver-orders-ediOrders[1]" is less then 0. If true, return 0 and if false return the result of "erpserver-orders-ediOrders[0] - erpserver-orders-ediOrders[1]". The value to use from the cache is defined by an index [X], where 0 is the latest value retrieved for the specific host-service-item.
The CalculateOnCache class can be used with service url bischeck://cache.
3.2.4 Check commands (Beta)
[New in 0.4.1]
With the CheckCommandServiceItem class performance data can be retrieved by executing a Nagios check command. The check command that is executed must output performance data according the Nagios specifications for the CheckCommandServiceItem to work. The execstatement query is formatted as a json structure. To execute a check command and retrieve a specific performance data the following statement example can be used:
{"check":"usr/lib/nagios/plugins/check_tcp -H localhost -p 22","label":"time"}
The above will execute the check_tcp program and retrieve the performance data with label time.
The benefit of using a check command from bischeck would be if there is a need to manage the performance data with dynamic thresholds that is not possible in Nagios Core.
Important is that there is no management of environment variables through bischeck when executing a check command.
The CheckCommandServiceItem class can be used for service url shell://localhost.
4 Date formatting
Many service items will typically execute something depending on a date. For this reason bischeck supports date macros in the execute statement for service items. For example, if this is a SQL select statement that using a date condition, the formatting could be done like this:
select count(orders) from order where
fromdate=’%%yyyy-MM-dd%%’ and
todate=’%%yy.MM.dd%[D2]%%’
bischeck will replace anything between %% and %% with the current date according to the format string. The formatting follows the structure of the Java SimpleDateFormatter class. If the format string includes a %[] macro, the current date will be calculated, where Y means year, M means month and D means day. So %[D-1] means subtract one day from the current date and %[M2] means add two months to the current date. A construction like D-1Y-1 is not supported.
5 Service item cache - LastStatusCache
Bischeck keeps a cache of the measured data points for every service items. The cache content can be used in the specification of execute statements of serviceitems and in threshold classes to create dynamic and adaptive thresholds, see section 6.1 on page 1↓.
The cached data is saved to disk every time bischeck is stopped and reloaded every time bischeck is started. The stored data is written to a file called lastStatusCacheDump and located in the directory specified by the property lastStatusCacheDumpDir, see 8.2↓. Before a save is made a backup file is created in the same directory called lastStatusCacheDump.bak.
5.1 Methods to retrieve cache data
There is a number of ways to retrieve data from the cache. The cache support both retrieval by index or by time, and the retrieval can be done for a single element or to a list of elements.
5.1.1 Retrieve single cache data element by index
For each service item the last 500 measured values are kept in the cache in a LRU list. To retrieve data from the cache the following format is used, host-service-item[index] where index is the lru entry, with 0 specifying that last retrieved measured value , e.g. erpserver-orders-ediOrders[0].
5.1.2 Retrieve single cache data element by time
Data can also be retrieved from the cache by using a time offset, like the cache data of erpserver-orders-ediOrders 30 minutes ago. This is specified by setting the index part to -30M, erpserver-orders-ediOrders[-30M]. This is useful since the relation between static index and service schedule do not need to be known. The time operator supported is S for seconds, M for minutes and H for hours.
5.1.3 Retrieve a list of cache data elements by index
For mathematical functions that operates of a list of elements, like a sum, avg, max, bischeck support two methods to reterive the range by index. The first method is to define a from “to index”, like erpserver-orders-ediOrders[0:9] that will retrieve all cache elements from index 0 to 9 as a list separated by “,” [C→]
[→C] The choice of , as separator character is due to this is the separator character used by JEP functions that take a list of values.
.
sum(erphost-orders-ediorders[0:9])
This will calculate the sum of the last 10 cached elements for erpserver-orders-ediOrders.
The second methods is to define a list of index that do not need to be in sequence, like erpserver-orders-ediOrders[1,3,5] that will retrieve the elements for index 1, 3 and 5 as a list separated by “,”.
sum(erphost-orders-ediorders[1,3,5])
5.1.4 Retrieve a list of cache data elements by time range
To retrieve list of the data elements based on a time range the expression has the format erpserver-orders-ediOrders[-30M:-120M]. This will retrieve a list of all elements that exist in the cache between 30 minutes to 120 minutes ago. The time operator supported is S for seconds, M for minutes and H for hours.
5.2 Mathematical expressions on cache data
In places where cache data can be used, like thresholds and serviceitems, it’s possible to use mathematical expressions on the data. In bischeck we use the mathematical package JEP to evaluate mathematical expressions and formulas. Lets look at some examples.
erphost-orders-ediorders[0] / erphost-orders-ediorders[-30M]
This example will divide the last cached data, index 0, for erphost-orders-ediorders with the cached data of erphost-orders-ediorders 30 minutes ago.
max(erphost-orders-ediorders[-5M],erphost-orders-ediorders[-10M],erphost-orders-ediorders[-15M]
In the above the highest value will be returned of the cached data for erphost-orders-ediorders cached 5, 10 and 15 minutes ago.
For more information of all functions that can be used please visit www.sourceforge.net and download the JEP distribution to get access to the JEP version 2 documentation.
5.2.1 JEP extensions
With JEP it’s easy to create additional functions. With bischeck the following functions has been added as part of the distribution.
- avg(x1,x2,x3,...) - Calculates the average of the list of values.
- max(x1,x2,x3,...) - Calculates the max value of the list of values.
- min(x1,x2,x3,...) - Calculates the min value of the list of values.
6 Threshold configuration
To define the state of the retrieved service items value a threshold class is specified for each service item. The threshold class evaluate the measured value with some logic and return the state as okay, warning or critical level. The threshold instance for the specific service item is stored in a threshold cache and valid for a period of a day. Every new day the threshold cache is invalidated and bischeck looks for new valid threshold classes to instantiate for the service item to be used for the period of a day. The reason that the period is set to a day is that there may be a need to configure the threshold instance differently depending on the day of the week or month.
A valid threshold class must implement the interface Threshold. This structure enables a flexible implementation of very different ways to calculate or specify a threshold. In the simplest form a threshold class could just return a okay independent of measured value and in the more complex solution be based on algorithms, database content, measured values from other service items, day of month or some complex combination.
Warning and critical level specification are also part of the threshold class. The threshold class are also responsible to define what operations are support for the measured value, like measured value should be higher, lower or in an interval of the threshold. Warning and critical level are always defined as the percentage of the threshold.
6.1 Twenty4HourThreshold class
The Twenty4Hour threshold class divides the day into 24 hours. For each hour of the day a threshold is defined. The two threshold values that are next to each other used to calculate a slope of a linear equation between the two closest hours. For example, if the threshold value is 1000 at 14:00 and 1600 at 15:00, the calculation for a threshold value between 14:00 and 15:00 is y=x*(1600-1000)/60 + 1000. At 14:20 the threshold is 20*(1600-1000)/60+1000 = 1200.
The threshold model gives a linear equation with one hour granularity, but over 24 hours it can resemble a curve. This behavior is typical in business systems where the key business values are distributed in a none linear and none constant way over the period of a day, e.g. incoming orders.
6.1.1 Period definition
Since the threshold for a service item can be different depending on the month, day of month, week, day of week the configuration supports thresholds to be described on a granularity called period. A period include multiple months and weeks definitions as long as they share the same threshold definition. For a month it is possible to specify a specific month and/or a day of a month and for a week a specific week and/or a day of a week. To find the right threshold period the the class look for threshold period specification in the following order:
- Month and day of month
- Week and day of week
- Day in month
- Day in the week
- Month
- Week
- Default
Month is specified between 1-12, week 1-53, day of month 1-31 and day of week 1-7 (1=Sunday). The default threshold period is used if no other matching occurs.
Since holidays are often days where the business are not operational there is a way to describe days that should no have any threshold checks. These exclude days are checked before any other rule above are evaluated.
6.1.2 Calculation definition
The class support tree ways how the threshold is compered to the measured value:
">" Measured value should be higher then threshold. If the measured value is lower then threshold*warning(%) warning state is set and if measured value is lower then threshold*critical(%) critical state is set.
"<" Measured value should be lower then threshold. If the measured value is higher then threshold*(1-warning(%)) warning state is set and if if measured value is higher then threshold*(1-critical(%)) critical state is set.
"=" Measured should be in the interval of the threshold. If the measured value is lower then threshold*warning(%) OR higher then threshold*(1-warning(%)) a warning state is set and if measured value is lower then threshold*critical(%) OR higher then threshold*(1-critical(%)) a critical state is set.
For complete configuration description see section 8.5 on page 1↓.
6.1.3 Hours and threshold definition
The measured value is compered against the threshold value that is calculated from linear equation of the two closest threshold values. As described in the introduction of this chapter we can set the threshold values to fixed number, but in a business system this is not enough. Let take an example. The number of orders that can be invoiced during a day is probably depending on the number of orders received. So instead of setting the threshold to a fixed number we can use an expression based threshold like “80 % of received orders”. The syntax of expression based thresholds is simple and powerful. Expressions are based on the JEP package, see chapter 16↓, where the parameters are any measured values that exist in the service item cache, see 5↑. For example the expression "erpserver-orders-ediorders[0]*0.8" is the threshold is set to 80% of the last measured value of the service item ediorders for the service order and host erpserver. We could also combine multiple cached values from different sources in the same expression like, "erpserver-orders-ediorders[0] / geoserver-route-finalroute[0]” to get some sort of ratio threshold.
If we just need to check parts of a day for thresholds, just set the hour to NULL and no calculation will be done for that time interval. For example if no threshold checks should be done on weekends just define period rule number 4 for day 1 and 6 with all hour thresholds set to NULL.
If we just need to check parts of a day for thresholds, just set the hour to NULL and no calculation will be done for that time interval. For example if no threshold checks should be done on weekends just define period rule number 4 for day 1 and 6 with all hour thresholds set to NULL.
7 Server integration
Since bischeck support integration with multiple monitoring its not possible to define a single message format or protocol. For that reason each Server class implementation is responsible for message formatting and communication with the integrated server. If the server system is not responding the message will be dropped on the bischeck side.
7.1 Nagios integration with NSCA and NRDP
The data format between bischeck and Nagios follow the standard Nagios format. This means that the Nagios host and service names must be the same as you configure in bischeck. Since NSCA and NRDP
[New in 0.4.1]
works with passive checks the check_dummy or equivalent check command should be used on the Nagios side in the service configuration. For a service in bischeck the data is split in the status and the performance output. The bischeck status output has the following format:
<level> <service item name> = <measured value> (<threshold> <warning value> <warning_calc method> <critical value>) <critical calc method> , <service item name> = ...
Since a service can have multiple service items, the output is presented as a concatenated string of the service items. The <measured value> is the value that was retrieved from the execution of the specific service item execute statement. The <threshold> is the current threshold value that the measured value has been compared against. The calculated warning and critical levels are also calculated based on the percentage value of the threshold.
Depending of the calculation method the string representation will differ. The following methods are support:
- Measure value must be higher the threshold: <warning level> = > W > <critical level> = > C >
- Measure value must be lower the threshold: <warning level> = < W < <critical level> = < C <
- Measure value must be in the interval to the threshold: <warning level> = = +-W = <critical level> = = +-C =
Example of the output:
OK ediOrders = 12000 (11000 > W > 9900 > C > 7700)
In this case the threshold value is 11000 and warning and critical levels has been set to 10% and 30 % of the current threshold. Since the warning and critical level are as a fixed percentage the calculated level will changed with the current threshold.
If there are no threshold values defined for the current period in which the measured value is done, the threshold is reported as null and no calculation is done that can be used for notification. Null can also be reported as the measured value. This can occur if a none or a null value is retrieved for the service item, for example from a faulty SQL statement.
Service connection problems will be reported as critical. Warning and critical notification will be based on the service item that has the highest level of severity if there are more then one service item defined for a service. If one service item reports critical and the other reports OK the service will report critical.
For the performance data, which Nagios graphs, like pnp4nagios, are based upon, each service item is included with the addition of the current threshold.
ediOrders=12000;9900;7000;0; threshold=11000;0;0;0; avg-exec-time=223ms
The execution time of the service execute statement is always part of the performance data and reported in milliseconds. With the pnp4nagios template that is provided by the bischeck installation the average execution time is not graphed.
7.1.1 NSCA configuration
The configuration parameters that need to be define in the server.xml for NSCA are:
- hostAddress - the IP or name for the NSCA server, default is localhost.
- port - the socket port number on the NSCA server where NSCA is listening, default is 5667.
- connectionTimeout - the timeout time in milliseconds before bischeck give up on the the connection, default is 5000.
- encryptionMode - the encryption mode used in the communication with the NSCA server, default is XOR.
- password - the NSCA server password, no by default.
7.1.2 NRDP configuration (Beta)
The configuration parameters that need to be define in the server.xml for NRDP are:
- hostAddress - the IP or name for the NRDP server, default is localhost.
- port - the socket port number on the NRDP server where NRDP is listening, default is 80.
- connectionTimeout - the timeout time in milliseconds before bischeck give up on the the connection, default is 5000.
- path - the URL path for NRDP, default is nrdp.
- password - the NRDP server token, no by default.
7.2 OpenTSDB
OpenTSDB is an monitoring system that provide storage and indexing of high volume of time series data. Access to the data in through a graphical web console provide easy way to view many different data sources for advanced analysis. The OpenTSDB integration is provided over OpenTSDB text based protocol. From bischeck the format will be the following for put host erpserver, service orders and service item ediOrders:
put bischeck.measured 1288946927 12000 host=erpserver service=orders serviceitem=ediOrders
put bischeck.threshold 1288946927 11000 host=erpserver service=orders serviceitem=ediOrders
put bischeck.warning 1288946927 9900 host=erpserver service=orders serviceitem=ediOrders
put bischeck.critical 1288946927 7700 host=erpserver service=orders serviceitem=ediOrders
So for each host, service and service item configuration 4 lines of data will be sent to the OpenTSDB server for the measured, threshold, warning and critical value.
The configuration parameters that need to be define in the server.xml for OpenTSDB are:
- hostAddress - the IP or name for the OpenTSDB server, default is localhost.
- port - the socket port number on the OpenTSDB server where OpenTSDB is listening, default is 4242.
- connectionTimeout - the timeout time in milliseconds before bischeck give up on the the connection, default is 5000.
8 bischeck configuration files
The basic configuration file are xml based and located in the $BISHOME/etc directory. The distribution package also include all xml schema, xsd, files used for validation. For detail information please review the xsd files located in the directory $BISHOME/resources. Remember that all xml configuration files should use HTML encoded characters.
8.1 bischeck.xml
The bischeck configuration can be described as a hierarchy of hosts, services and service items to monitor. Each host can have one or more services, and for each service one or more service items can be configured.
1<bischeck> 2 <host> 3 <name>erpserver</name> 4 <desc>ERP server</desc> 5 <service> 6 <name>orders</name> 7 <desc>Order management</desc> 8 <schedule>0 0/5 * * * ?</schedule> 9 <url> 10 jdbc:mysql://erphost/erpdb?user=bischeck&password=bischeck 11 </url> 12 <driver> 13 com.mysql.jdbc.Driver 14 </driver> 15 <serviceitem> 16 <name>ediorders</name> 17 <desc>Inbound edi orders</desc> 18 <execstatement> 19 select count(*) from orders where createdate='%%yyyy-MM-dd%%' 20 </execstatement> 21 <thresholdclass> 22 Twenty4HourThreshold 23 </thresholdclass> 24 <serviceitemclass> 25 SQLServiceItem 26 </serviceitemclass> 27 </serviceitem> 28 </service> 29 </host> 30</bischeck>
In the host section the following elements are defined:
- name - the name of the host. [D→] [→D] Must be the same name as the host name is configured with on the Nagios server.
- desc - a optional description field
In the service section the following elements are defined:
- name - name of the service. [E→] [→E] Must be the same name as the host name is configured with on the Nagios server.
- desc - a optional description field
- schedule - one to many service execution schedules can be defined. See the section 9↓ for more information about configuration options.
- sendserver - true or false to define if the service data should be sent to the configured monitoring servers, see 8.4↓. [New in 0.4.0] . If set to false the measured data will only be placed in the bischeck cache and be used to create virtual services and threshold rules.
- url - the connection specification for the server/service to monitor in a url format
- driver - a class that is needed by the url specification. The driver class should be placed in the customlib directory.
In the service item section the following elements are defined:
- name - name of the service item
- desc - a optional description field
- execstatement - the specification of what to be executed by the service item. The statement will be dependent on the type of service item class used.
- serviceitemclass - the ServiceItem class to use for the service item. For ServiceItem classes that are part of the distribution the class name is enough. For custom developed ServiceItem classes the full class name should be specified and the classes or jar files should be located in the customlib directory.
- thresholdclass - the Threshold class to be used by the service item configuration. For Threshold classes part of the distribution the class name is enough. For custom developed Threshold classes the full class name should be specified and the classes or jar files should be located in the customlib directory.
It is important that the name field for host, service and serviceitem do not include any space characters or the dash (-) character.
8.2 properties.xml
The properties.xml include properties used by the core of bischeck, but can also be used by custom developed services and threshold classes. The properties xml has a simple structure of key/value pair:
1<properties>
2	<property>
3		<key>akey</key>
4		<value>avalue</value>
5	</property>
6</properties>
Any properties should have a default value that is set in code. The following properties are currently used by core bischeck:
- thresholdCacheClear- the time when the threshold cache should be evicted each day, default is "10 0 00 * * ? *".
- pidfile - the pid file for bischeck, default is "/var/tmp/bischeck.pid".
- mindaysinfirstweek - define the week numbering according to ISO 8601, default is 4.
- firstdayofweek - define the week numbering according to ISO 8601, default is 2.
- lastStatusCacheDumpDir - the directory where cache is stored, default is /var/tmp.
- lastStatusCacheSize - the maximum size of cached data per host, service and serviceitem, default is 500.
- runAfterDelay - the delay time in seconds used when a service is scheduled to run with “Service relation scheduling”, see 9↓. Default is 10 seconds.
The properties.xml file can also include class specific properties typical used for custom developed service, service item and threshold classes. A class specific property should have a key formatted in the following way - classname.propertyname
Any class specific properties must have a default value implemented by the class itself. E.g. for JDBCService there is a property called querytimeout that sets the max time in seconds before aborting the query. This property has the name JDBCService.querytimeout and have a default value of 10 seconds.
8.3 urlservice.xml
The configuration define of the mapping between service url schema and Service class. The urlservice xml has a structure of:
1<urlservices>
2	<urlproperty>
3		<key>jdbc</key>
4		<value>JDBCService</value>
5	</urlproperty>
6	<urlproperty>
7		<key>bischeck</key>
8		<value>LastCacheService</value>
9	</urlproperty>
10</urlservices>
- key – the schema part of the service url, i.e. jdbc.
- value – the Service class name. For Service classes part of the distribution the class name is enough to specify. For custom developed Service classes the full class name should be specified and the classes or jar files should be located in the customlib directory.
8.4 server.xml
The configuration file define the mapping between service url schema and Server class. The urlservice.xml has a structure of:
1<servers> 2 <server name="Nagios1"> 3 <class> 4 com.ingby.socbox.bischeck.servers.NSCAServer 5 </class> 6 <property> 7 <key>hostAddress</key> 8 <value>localhost</value> 9 </property> 10 <property> 11 <key>encryptionMode</key> 12 <value>XOR</value> 13 </property> 14 <property> 15 <key>password</key> 16 <value>change this</value> 17 </property> 18 <property> 19 <key>port</key> 20 <value>5667</value> 21 </property> 22 <property> 23 <key>connectionTimeout</key> 24 <value>5000</value> 25 </property> 26 </server> 27 28 <server name="Nagios2"> 29 ...... 30 </server> 31 32</servers>
Each server that is integrated with bischeck must be defined with the server tag and with a unique attribute name. This solution enable bischeck to send data to multiple servers of the same type, like multiple Nagios servers. The class tag define what Server class implementation to use for the integration. Each Server implementation can have different numbers of properties that is specific for the Server class. Custom developed server classes should be placed in the customlib directory
8.5 24thresholds.xml
The threshold class Twenty4HourThreshold described in section 6.1↑is configured through the 24thresholds.xml file.
1<twenty4threshold> 2 <servicedef> 3 <hostname>erpserver</hostname> 4 <servicename>shipments</servicename> 5 <serviceitemname>outboundshipment</serviceitemname> 6 7 <period> 8 <!-- valid for any 21th day in the month --> 9 <months> 10 <dayofmonth>21</dayofmonth> 11 </months> 12 13 <!-- valid for week 12 (middle of March) 14 and if its a Thursday --> 15 <weeks> 16 <week>12</week> 17 <dayofweek>5</dayofweek> 18 </weeks> 19 20 <calcmethod>></calcmethod> 21 <warning>10</warning> 22 <critical>30</critical> 23 <hoursIDREF>1</hoursIDREF> 24 </period> 25 26 <period> 27 <!-- valid if its a Friday --> 28 <weeks> 29 <dayofweek>6</dayofweek> 30 </weeks> 31 <calcmethod>></calcmethod> 32 <warning>10</warning> 33 <critical>30</critical> 34 <hoursIDREF>2</hoursIDREF> 35 </period> 36 37 <period> 38 <!-- This will be used if no 39 other rule if applicable --> 40 <calcmethod>></calcmethod> 41 <warning>10</warning> 42 <critical>30</critical> 43 <hoursIDREF>31</hoursIDREF> 44 </period> 45 46 </servicedef> 47 48 <hours hoursID="1"> 49 <!-- 00:00 --> 50 <hour>500</hour> 51 <!-- 01:00 --> 52 <hour>1500</hour> 53 <!-- 02:00 --> 54 <hour>4000</hour> 55 ................. 56 <!-- 21:00 --> 57 <hour>9000</hour> 58 <!-- 22:00 --> 59 <hour>10000</hour> 60 <!-- 23:00 --> 61 <hour>11000</hour> 62 </hours> 63 64 <hours hoursID="2"> 65 <!-- 00:00 --> 66 <hour>1500</hour> 67 <!-- 01:00 --> 68 <hour>2500</hour> 69 <!-- 02:00 --> 70 <hour>5000</hour> 71 ................. 72 <!-- 21:00 --> 73 <hour>10000</hour> 74 <!-- 22:00 --> 75 <hour>12000</hour> 76 <!-- 23:00 --> 77 <hour>14000</hour> 78 </hours> 79 80 <hours hoursID="2"> 81 <!-- 00:00 --> 82 <hour>500</hour> 83 <!-- 01:00 --> 84 <hour>erpserver-orders-ediorders[0]*0.8</hour> 85 <!-- 02:00 --> 86 <hour>erpserver-orders-ediorders[0]*0.8</hour> 87 ................. 88 <!-- 21:00 --> 89 <hour>erpserver-orders-ediorders[0]*0.3</hour> 90 <!-- 22:00 --> 91 <hour>null</hour> 92 <!-- 23:00 --> 93 <hour>null</hour> 94 </hours> 95 96 <!-- Holidays --> 97 <holiday year="2011"> 98 <dayofyear>0101</dayofyear> 99 ................. 100 <dayofyear>1224</dayofyear> 101 <dayofyear>1225</dayofyear> 102 </holiday> 103 104</twenty4threshold>
The configuration is based on two main parts, a servicedef tag and an hours tag. For each combination of host, service and serviceitem a servicedef tag is specified. Each servicedef can have one to many period specifications, see 6.1.1↑. The period specify what hoursID that should be used for a specific combination of months and weeks definitions, see 6.1.3↑for more information. The period also define calculation method, warning and critical level, see 6.1.2↑.
The hours tag must have 24 hour tags, each represent on hour of the day. An hour tag can have a null value, meaning no threshold, a fixed value or an mathematical expression according to JEP, but with variables from any measured value existing in the last value cache, see 5↑. For more information about threshold specifications please see 6↑. The final section, holidays, describe any day of the year where no threshold will be tested. For that reason the service will always return a OK state if bischeck services is ran and using the threshold class Twenty4HourThreshold.
9 Service scheduling
The service scheduling define when a service is triggered to be executed. For each service there can be multiple scheduling configurations, but at lest one is mandatory. The scheduling can be described in three ways.
9.1 Interval scheduling
The simple format describe a interval execution that are repeated forever. The format is just a number and a indicator defining the granularity in seconds (S), minutes (M) or hours (H). 10M specify that the service should be executed every ten minutes.
1<schedule>10M</schedule>
9.2 Cron based scheduling
The second format is more advanced and follow the cron specification of Quartz, see http://www.quartz-scheduler.org. With this format its possible to define scheduling expression like “0 15 10 ? * MON-FRI” which would schedule the service at 10:15am every Monday, Tuesday, Wednesday, Thursday and Friday. For more cron examples please visit http://www.quartz-scheduler.org/documentation/quartz-2.x/tutorials/crontrigger
1<schedule>0 15 10 ? * MON-FRI</schedule>
9.3 Service relation scheduling
[New in 0.4.0]
The service relation scheduling trigger a service to execute after another service has been scheduled. This is useful when a service is depending on data for another service for its thresholds or execution statement. The format is “host-service” specifying the host and service that will trigger the execution of the service.
1<schedule>erpserver-orders</schedule>
10 Configuration tools
Bischeck provides by default no additional tools for configuration other than the normal editor to manage the xml configuration files. The default configuration files in etc directory are valid for the test example configuration, see 13.2↓.
A web based configuration tool, bisconf, is under development. Bisconf will be hosted on the bischeck project site, http://www.bischeck.org.
11 bischeck internal surveillance
bischeck use the Java JMX standard for internal monitoring. Please read the javadoc for the classes ExecuteMBean and LastStatusCacheMBean to to understand the methods available or just start jconsole or equivalent tool.
The following JMX settings are used by default and set in the bischeck script located in the $BISHOME/bin directory.
jmxport=-Dcom.sun.management.jmxremote.port=3333
jmxssl=-Dcom.sun.management.jmxremote.ssl=false
jmxauth=-Dcom.sun.management.jmxremote.authenticate=false
jmxpasswd=-Dcom.sun.management.jmxremote.password.file=$bishome/etc/jmxremote.password
jmxaccess=-Dcom.sun.management.jmxremote.access.file=$bishome/etc/jmxremote.access
If authentication should be used please change the property
com.sun.management.jmxremote.authenticate to true and configure the roles and password in the files jmxremote.access and jmxremote.password. For more information how to configure JMX please visit
http://www.oracle.com/technetwork/java/javase/tech/javamanagement-140525.html.
com.sun.management.jmxremote.authenticate to true and configure the roles and password in the files jmxremote.access and jmxremote.password. For more information how to configure JMX please visit
http://www.oracle.com/technetwork/java/javase/tech/javamanagement-140525.html.
JMX is only enabled when the bischeck script is called with the argument "Execute -d", which is the way bischeckd init script call the script bischeck to start bischeck in daemon mode.
12 Building bischeck
To build bischeck from source is simple. Check out the bischeck trunk from gforge.ingby.com:
$ svn checkout --username anonymous http://gforge.ingby.com/svn/bischeck/trunk bischeck
To build a bischeck distribution run from the directory where you checked out the bischeck code:
$ ant dist
This will create a compressed tar file in the target directory, named bischeck-x.y.z.tgz where x.y.z is the version number. Different versions of bischeck can be checked out from the tags directory located in http://gforge.ingby.com/svn/bischeck/tags
12.1 Jar customization
To support custom jar files please place them in the directory customlib. This would typical be jdbc drivers, custom threshold classes, etc.
12.2 Developing with bischeck
Its simple to develop your own service, service item and threshold classes. To develop your own you must follow the interface that exist for each type. For service and service items an abstract class exist with default implementation of most of the methods described in the interfaces.
13 Installation
The latest binary version of bischeck is available on http://www.bischeck.org.
Download the distribution file and follow the steps below to install. Make sure you have root privileges doing this.
# tar xzvf bischeck-x.y.z.tgz
# cd bischeck-x.y.z
# chmod 755 install
# ./install -u #Get usage
# ./install    #Install default
# service bischeckd start    #Redhat/Centos
# /etc/init.d/bischeck start #Debian/Ubuntu
To get full list of available options to the install script use -u. By default the install script will install bischeck in directory /opt/socbox/addons/bischeck, referred to as $BISHOME, and with the ownership of the user id nagios. Make sure that the user exist before running install.
The last commands start the bischeck daemon with the effective user id of the user id set during install, default user nagios. The installation will configure bischeckd to start automatically in run level 3, 4 and 5.
The process id of the java process running bischeck in daemon mode is located in a file, default in /var/tmp/bischeck.pid. This file is used by the bischeckd script to stop the java program running bischeck and make sure that only one instance of bischeck is started on the server.
13.1 Upgrading
From version 0.3.2 upgrading is possible. If you already have an installation download the new version as described in the previous chapter but to upgrade run:
# ./install -I /opt/socbox/addons/bischeck -X
The upgrade will save the current installation in a directory parallel to the new version named bischeck_x.y.z, where x.y.z is the version of the old installation.
The file migrationpath.txt describe the supported upgrade paths and what migration scripts that will be run by the install script when running in upgrade mode, -X.
If the upgrade is successful bischeck can be started.
# service bischeckd start
13.2 Getting started
In the $BISHOME/etc directory there are examples of all the configuration files. These works as an examples to get started with a simple bischeck setup of monitoring a Mysql database table. Scripts to create the test database is found in the examples directory. You do not need a nagios server setup to run the test, just monitor the bischeck log file located by default in /usr/tmp/bischeck.log. To run the example the mysql jdbc driver is required and the jar file, typical mysql-connector-java.jar should be copied to the $BISHOME/customlib directory to automatically be part of bischecks classpath.
$ cd $BISHOME
$ cat examples/create_bischeckverify.sql | mysql -u root
$ cp <some location>/mysql-connector-java.jar customlib/
$ sudo /etc/init.d/bischeckd restart
$ tail -f /usr/tmp/bischeck.log
13.3 Integration with pnp4nagios
pnp4nagios can create graph layouts depending on the check command used for the service on the Nagios server. Since bischeck use a passive check we need to create a unique check command that match the pnp4nagios layout for bischeck. Create a link in the libexec directory on the nagios server:
nagios$ ln -s check_dummy check_bischeck
When describing the service always use the check_bischeck as the check command. The check_bischeck.php that control the pnp4nagios layout must be copied to the directory pnp4nagios/share/templates on the Nagios server.
13.4 Logging
bischeck use log4j for log management. The log4j configuration is described in the log4.properties file located in the resources directory of the bischeck installation. By default bischeck writes log information at level INFO to file /var/tmp/bischeck.log.
14 Command line utilities
There is a number of command line utilities available in bischeck. All can be ran through the bischeck script located in the $BISHOME/bin directory. To use the bischeck script add it to your PATH variable.
$ PATH=$BISHOME/bin:$PATH
14.1 Run bischeck
The normal way to run bischeck is as a daemon using the init.d script bischeckd, but is also possible to start bischeck in continues running mode by executing:
$ bischeck Execute -d
Running in this way have limitations since the execution will not automatically be placed as a background process and the effective user id will be the user starting the process which may not have all permissions according to the installation. Neither will pid files be updated correctly. For production system always use the init.d script.
$ sudo /etc/init.d/bischeckd start
or
# service bischeckd start
For testing purpose it can be good to just run bischeck once and make sure that every thing is executing as expected. This is done by executing:
$ bischeck Execute
This will override all scheduling definitions and execute everything directly, but only once.
To show the pid file used for the bischeck daemon running:
$ bischeck ConfigurationManager -p
This command is used in the init script bischeckd to retrieve the current pid.
14.2 List bischeck configuration
Formatted listing of all configuration files is managed by the DocManager class.
To generate the configuration files in html format:
$ bischeck DocManager -d <directory name> -t html
The files are generated to the directory set with -d. Point your browser to the index.html file in the directory to get links to each configuration file.
To get the same but in plain text:
$ bischeck DocManager -d <directory name> -t text
If -d is omitted the files file be created in the default directory bisheckdoc. The default value for -t is html.
14.3 Validating configuration files
To validate if the xml configuration files are correct the following command will return 0 if correct. Use $? to see return status.
$ bischeck ConfigurationManager -v; echo $?
14.4 Twenty4HourThreshold testing
To verify which threshold rule that will used for a specific host, service and service item for a specific date run:
$ bischeck threshold.Twenty4HourThreshold -h erphost -s orders -i ediorders -d 20111207
The above command will show which threshold definition that will be used for host erphost, service orders and serviceitem ediorders on seventh of December 2012. If -d is omitted the current date will be used.
15 Releases
15.1 Release 0.4.1 - 2012-10-0X
15.1.1 New feature
- [FR-224] Beta support for NRDP through the new server class NRDPServer.
- Beta support for executing check commands. The check commands that can be used must support an output of performance data. Bischeck will not care about the status that comes from a check command. Instead it will only use the performance data to evaluate its own threshold. This include the new service class ShellService and serviceitem class CheckCommandServiceItem.
-
Instrumentation metrics provided by http://metrics.codahale.com/ has been implemented to enable fine grain real time process measuring through JMX. This is implemented for
- All external interfaces to measure response time
- Service execution time
- Threshold processing time, etc.
15.1.2 Bugs fixed and important issues
- [TR-226] has been fixed. The bug was related to when bischeck was used with data points with many decimals, like the result from a ping. bischeck would strip of all decimals except 2 with caused small values to become 0. Now bischeck will determine the number of decimals used by the collected data point and use it when formatting the calculated threshold, warning and critical value. This will hopefully make data presented in Nagios UIs and graphs like pnp4nagios look better.
15.1.3 Upgrading
Release 0.4.0 is supported for upgrade to 0.4.1.
15.2 Release 0.4.0 - 2012-08-31
15.2.1 New feature
- [FR-197] Support for different and multiple integration with different surveillance and monitoring systems. With version 0.4.0 bischeck is not limited to send data to Nagios. It can now send the data to multiple Nagios servers and to other servers like OpenTSB. This is done by moving server formatting and protocol to server integration classes that implements the interface com.ingby.socbox.bischeck.servers.Server. The server integration is described in the xml configuration file servers.xml. This also means that that some Nagios NSCA specific properties previous configured in properties.xml has been moved to the servers.xml file in the NSCA section. The OpenTSDB server class should be regarded as beta.
- [FR-204] The bischeck cache will be saved when the bischeck daemon is shutdown and reloaded on bischeck startup. Keeping the cache persistent between restarts is important since 0.4.0 support time based cache retrieval. The limitations is currently that if the bischeck daemon is killed by a signal that can not be caught or the daemon crash the data will not be saved. This will be improved in future versions.
- [FR-202] The implementation of running bischeck once, in a none daemon mode, is changed so the same code is used as running in daemon mode. The only difference is that the initialization of triggers are different so all service items are just ran directly and and just once.
- [FR-218] The bischeck daemon can now reload the configuration without a process restart. This is support through the JMX operation “reload”. The feature will limit the need of operating system access and authorization.
- [FR-219] Bischeck can now retrieve state and performance data from a Nagios server supporting livestatus. With the service class LivestatusService a connection is set up over livestatus and with the and serviceitem class LivestatusServiceItem state and/or performance data can be retrieved from the a Nagios service. This can be useful when when creating virtual services in bischeck or used in complex thresholds.
- [FR-220] Bischeck now support one additional scheduling method where scheduling can be defined to run a service after a different service has executed. This can be useful when a service is depending on data for another service for its thresholds or execution statement.
- [FR-221] Cache retrieval is now support by using a time offset to find the nearest cache element to the time offset.
- Cache data can be retrieved as a list of elements based both on index and time.
- Support for additional mathematical functions like average, min and max calculations on list of elements.
-
Bischeck can now support the usage of cached data in an execution statement of a serviceitem. This is typical useful when a serviceitem execute statement is depending on other service data. For example in a SQL query string:
select value from table1 where id = host1-web-state[0] and createdate = ’%%yyyy-MM-dd%%’");
- Added support for other Linux distributions then Redhat based. bischeck should now install on Debian 6 and Ubuntu 10/11.
- Configuration listing. The configuration listing has been moved from the ConfigurationManager class to the DocManager class. Currently html and text listing is supported. The generated configuration data will by default placed in the bischeckdoc directory.
- A configured service can be configured not to send its data to a the configured monitoring servers like Nagios. This can be useful if the service is just to be used to create virtual services or just to be used as thresholds.
-
The bischeck script now support JMX authentication. The authentication files are located in the etc directory and named jmxremote.password and jmxremote.access. Default is to that authentication is disabled by the system property
“-Dcom.sun.management.jmxremote.authenticate=false”. To enable authentication set the property to true. For more info about JMX see
http://www.oracle.com/technetwork/java/javase/tech/javamanagement-140525.html.
15.2.2 Bugs fixed and important issues
-
The Twenty4Thresholds class was in previous version not doing a correct linear equation calculation if a expression based threshold was defined. Lets illustrate the errors with this example from the 24thresholds.xml configuration file having a mix with static and expression based thresholds.
....
<!-- 12:00 -->
<hour>7000</hour>
<!-- 13:00 -->
<hour>testhost-testservice-testitem[1] / 3</hour>
<!-- 14:00 -->
<hour>testhost-testservice-testitem[1] / 2</hour>
<!-- 15:00 -->
<hour>testhost-testservice-testitem[1] + 1000 </hour>
<!-- 16:00 -->
<hour>12000</hour>
....
In the previous version the threshold value between 12:00 and 13:00 would be null since it was a mix of static and expression based thresholds. And between 15:00 and 16:00 the threshold would have been calculated as “testhost-testservice-testitem[1] + 1000” independent of the time between 15:00 and 16:00.Now the linear equation will correctly be calculated with any mix of static and expression based definitions. In the above example the calculated threshold for 12:20 will now be:
20*((testhost-testservice-testitem[1]/3) - 7000)/60 + 7000
This fix will improve the correctness and also the capability of threshold adaptivity. -
The Service interface has a number of new methods that should been there from the beginning. If you developed any service class you need to add these, but if you just inherited ServiceAbstract its fixed for you. The new methods are:
public NAGIOSSTAT getLevel();
public void setLevel(NAGIOSSTAT level);
public boolean isConnectionEstablished();
public void setConnectionEstablished(boolean connected);
public Boolean isSendServiceData();
public setSendServiceData(Boolean sendServiceData);
- Property cacheclear is renamed to thresholdCacheClear.
- All the nsca related properties has been moved from properties.xml to servers.xml when used for the NSCAServer class. The new property names has also gone through some minor changes. When upgrading a manual update is needed of the servers.xml file with the current setting of nsca related properties in properties.xml. Recommended that these are later removed.
- All JAXB generated configuration classes now support serialization.
- Quartz jar is upgraded from 2.0.1 to 2.1.5.
- [TR-216] “Shutdown is automatic triggered”
- [TR-217] “Configuration Manager initialization failed with java.lang.NullPointerException”
- [TR-207] “sudo in bischeckd script cause problem at boot”
15.2.3 Upgrading
Release 0.3.3 and 0.4.0_RC2 are supported for upgrade to 0.4.0.
15.3 Release 0.3.3 - 2011-11-14
15.3.1 New features
- bischeck are no longer limited to just be integrated with a single Nagios server over the NSCA protocol. Now is it possible to integrate with multiple monitoring servers over different protocols. Currently Nagios/NSCA and OpenTSDB is support. To enable this a new class component called Server has been introduced. The class is responsible for communication and formatting for the specific monitoring server it integrate against. A new configuration file, server.xml is used for configuration of server integration.
15.3.2 Bugs fixed and important issues
- [TR-207] “sudo in bischeckd script cause problem at boot”
- [TR-214] “Threshold object cache is no cleared”
15.4 Release 0.3.2 - 2011-07-29
15.4.1 New features
- The configuration system has been completely rewritten and now us xml based configuration files. Each configuration file has a corresponding xsd file that can be used for verifications. The dependencies to sqlite3 has been deprecated and is just part of this release to support upgrade.
- The scheduling of services and its related serviceitem(s) has been rewritten to support different scheduling polices per service instead of earlier versions of fixed interval scheduling. With 0.3.2 each service can have one to many schedule tags in bischeck.xml configuration file. For more info please see the chapter 9 on page 1↑.
15.4.2 Bugs fixed and important issues
- The active attribute on Hosts, Services and Serviceitem has been removed.
- The interface com.ingby.socbox.bischeck.threshold.Threshold has a new signature on the method init(). This method now throws Exception.
- The Service interface has two additional methods, setSchedules() and getSchedules().
- The Service interface has changed the signature of getServicesItems() to return Map instead of HashMap.
- buildr has been replaced by ant as the build management system.
15.5 Release 0.3.1 - 2011-04-08
15.5.1 New features
-
The ServiceFactory class now use a property table, urlservice, to map what Service class should be instantiate for a specific url schema. The url schema is the key. The current default mapping are:
- jdbc -> JDBCService
- bischeck -> LastCacheService
- The ServiceItemFactory class use an additional field, serviceitemclass, in the items configuration table to determine what ServiceItem class to instantiate.
- Calendar in bischeck follows the ISO 8601 date standard by default. This means that the first day in the week is Monday, day 2 according to java.utilCalendar, and that the first week of the year must have a minimum of 4 days. The importance of this is to get the week numbering correct that is used in the configuration in Twenty4HourThreshold class, but day one (1) in the week is still Sunday when defining the tag dayofweek in 24threshols.xml. The setting can be overidden by setting the properties “mindaysinfirstweek” (default 4) and “firstdayofweek” (default 2) in the properties.xml file.
- If no threshold class has been specified, null in the thresholdclass field in the items table, bischeck will instantiate the “empty” class DummyThreshold.
- For all class configuration of Service, ServiceItem and Threshold its now possible to specify the class name without the package path if the class is part of the bischeck distribution.
- Clean up of the exception handling process when starting bischeck. Now the execution should not start if there are configuration issues with missing classes for Service, ServiceItem and Threshold.
15.5.2 Bugs fixed and important issues
- N/A
15.5.3 Upgrade issues
- Upgrade by doing a fresh installation, but first save the old installation directory. After saving the old installation do a new install. Then copy the files bischeck.conf and 24threshold.conf from old to new installation dir.
- The field serviceitemclass (varchar(256)) in table items in configuration database bischeck.conf must be manual added and populated with the right Service class name. If corresponding service is jdbc:// set the field serviceitemclass to SQLServiceItem and if the service is bischeck:// set the field to CalculateOnCache.
-
To add the column:
$ sqlite3 bischeck.conf sqlite> ALTER TABLE items ADD COLUMN serviceitemclass varchar(256);
-
Update the serviceitemclass for all rows in items:
- sqlite> update items set serviceitemclass=’SQLServiceItem’ where .... ....
- sqlite> update items set serviceitemclass=’CalculateOnCache’ where ..... ....
-
Add the new table url2service in database bischeck.conf.
$ cat << EOF | sqlite3 bischeck.conf drop table IF EXISTS urlservice; create table urlservice(key varchar(128), value varchar(256)); insert into urlservice values ("jdbc","JDBCService"); insert into urlservice values ("bischeck","LastCacheService"); EOF - Copy all file located in the old installation customlib directory to the customlib directory in the new installation.
15.6 Release 0.3.0 - 2011-03-03
15.6.1 New features
- This is the first binary distribution, but should be regarded as a beta version.
15.6.2 Bugs fixed and important issues
- N/A
16 System requirements
bischeck should run on any operating system that supports Java 6. The installation script and init scripts are supported on Redhat and Debian equivalent Linux distributions. Running on none Linux operating system has not been tested.
The following jar packages are distributed as part of the bischeck distribution. All these packages have their own open source licenses.
- commons-lang-2.5.jar - http://commons.apache.org/lang/
- commons-cli-1.2.jar - http://commons.apache.org/cli/
- log4j-1.2.16.jar - http://logging.apache.org/log4j/ Apache project
- quartz-2.1.5.jar - http://www.quartz-scheduler.org/
- jsendnsca-2.0.1.jar - http://code.google.com/p/jsendnsca/
- slf4j-api-1.6.0.jar - http://www.slf4j.org/
- slf4j-log4j12-1.6.0.jar - http://www.slf4j.org/
- jep-2.3.1.jar - http://sourceforge.net/projects/jep/
- json-lib-2.4 - http://json-lib.sourceforge.net/
- ezmorph-1.0.6.jar - http://ezmorph.sourceforge.net/
- commons-beanutils-1.8.3.jar - http://commons.apache.org/beanutils/
- commons-collections-3.2.1.jar - http://commons.apache.org/collections/
- metrics-core.jar - https://github.com/codahale/metrics
All jar files distributed as part of bischeck are located in the lib directory.
17 bischeck license
bischeck is licensed under GNU license version 2. For more info please visit http://www.gnu.org/licenses/gpl-2.0.html
18 Bug reports and feature requests
Please submit bug reports and feature requests on www.bischeck.org in the Forge section.
19 Credits
Thanks to all people who has developed all the great software that bischeck depends on, and especially all who made Nagios and the Nagios community a success. A special thanks goes to Peter Johansson and his colleagues at DHL Freight Sweden for sponsoring the development and providing ideas and important feedback.